Updated November 29, 2018.
This is the first post in our Lego series, a 10 part mini-bonanza on augmenting your existing BI investment with Plotly’s online, collaborative, and exploratory visual analytics platform.
Our first post is on dashboards: The communications currency of the business intelligence world.
Want to bring Dash into your company? Contact our sales team to schedule a demo.
Dash is empowering to use. Easy to install, you can start creating a dashboard (or any kind of analytical application) in seconds. Under the hood, Dash is built on React, Flask, and Plotly.js. But don’t worry, you only write your applications using Python, the language of data science, machine learning, and AI. This is what makes Dash a standard tool for scientific research and complex analytics.
If you already have Tableau or another dashboard solution, there are still many reasons to try Dash:
1… Simplify That Pipeline.
Dash applications are written in Python, which is excellent for wrangling unstructured data, performing statistical analysis, and automating routine tasks. Dash lets you build and publish your visualizations in the same language you use to write your algorithms and analytical code.
2… Connect to New Databases.
Dash apps can connect directly to some advanced data sources that Tableau does not support, such as Elasticsearch. You can also contact us to request a custom data source connector.
3… Browser-Based Applications.
Dash applications are web applications, which makes Dash lightweight but powerful. It takes only a few minutes to create and share a Dash app as an HTML file. Dash apps are ideal for agile and collaborative data science teams.
4… Maps, Advanced Charts, and Style 😎
Dash uses D3.js and WebGL, gold standards of interactive web graphics. You can even style Dash apps to match your brand. Dash has many 3D charts, advanced statistical charts, and maps that do not come with Tableau.
Here are 10 Dash apps created by Plotly to help you get started:
1. INTERACTIVE, PRINTABLE REPORT
This application recreates a Vanguard report, but Dash’s flexible framework lets you customize however you see fit. After you’ve crafted exactly the data view you need, use the “Print to PDF” button and make a splash at your next meeting.
See it in action: https://dash-gallery.plotly.host/dash-vanguard-report.
2. INTERACTIVE SPREADSHEETS
Create complex, spreadsheet-driven applications with Dash DataTable. This interactive table lets you view, edit, and explore large datasets from the web browser, and is Plotly’s most complex Dash component to date.
DataTable is a Dash component. For more information, visit: https://dash.plot.ly/datatable.
3. SALES DASHBOARD
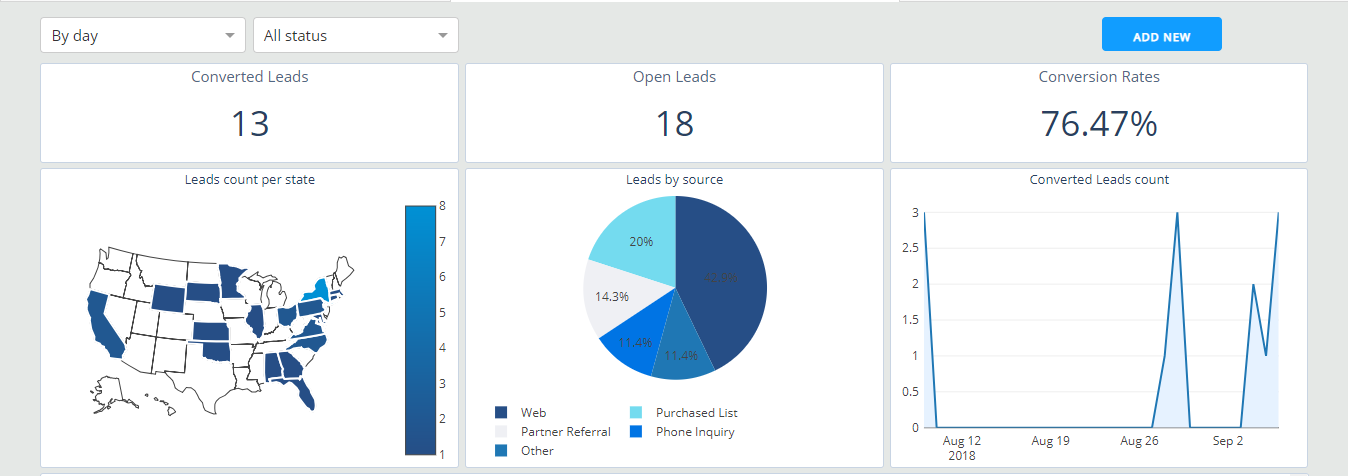
Keep tabs on your organization’s sales activity with a Dash app. Check out this traditional dashboard-style CRM application, where you can switch between multiple tabs to track leads, sales, and sources using the most appropriate charts for each scenario.
Try it out: https://dash-gallery.plotly.host/dash-salesforce-crm
4. PRODUCTION ACROSS TIME
Need a wide-angle view? Dash has you covered. Select the desired time range you want to explore using interactive sliders and graphs. This particular dashboard-style application displays New York State natural gas well production.
See how it works: https://dash-gallery.plotly.host/dash-oil-and-gas
5. MULTI-LEVEL PIE CHARTS
Also known as sunburst graphs, these visualizations are great for displaying hierarchical data. Dash apps are interactive, so you can take your data communication a step further by exploring different data categories as the graph updates in real time.
Dash sunburst graphs are a component that can be inserted in your Dash application. Learn more here: https://github.com/plotly/dash-sunburst
Dash sunburst graphs were sponsored by an organization. If your company or organization would like to sponsor our development directly or through our commercial offerings, please reach out.
6. NETWORK GRAPHS
Understanding relationships is key to business. Whether it’s a complex supply chain, new organizational layout, product distribution, or social network, Dash network graphs are a dynamic way to explore and display complex relationships.
Network graphs are a Dash component. To learn more: https://github.com/plotly/dash-network
Dash network graphs were sponsored by an organization. If your company or organization would like to sponsor our development directly or through our commercial offerings, please reach out: https://plot.ly/products/consulting-and-oem/
7. TRACKING THE MARKET
Get a live visual on the day’s ups and downs with a Dash app like this one, which tracks the foreign exchange. Dash’s callback system enables continuous queries for the latest updates, no matter which market you’re targeting.
View the demo app here: https://dash-gallery.plotly.host/dash-web-trader
8. MULTI-YEAR MAPPING
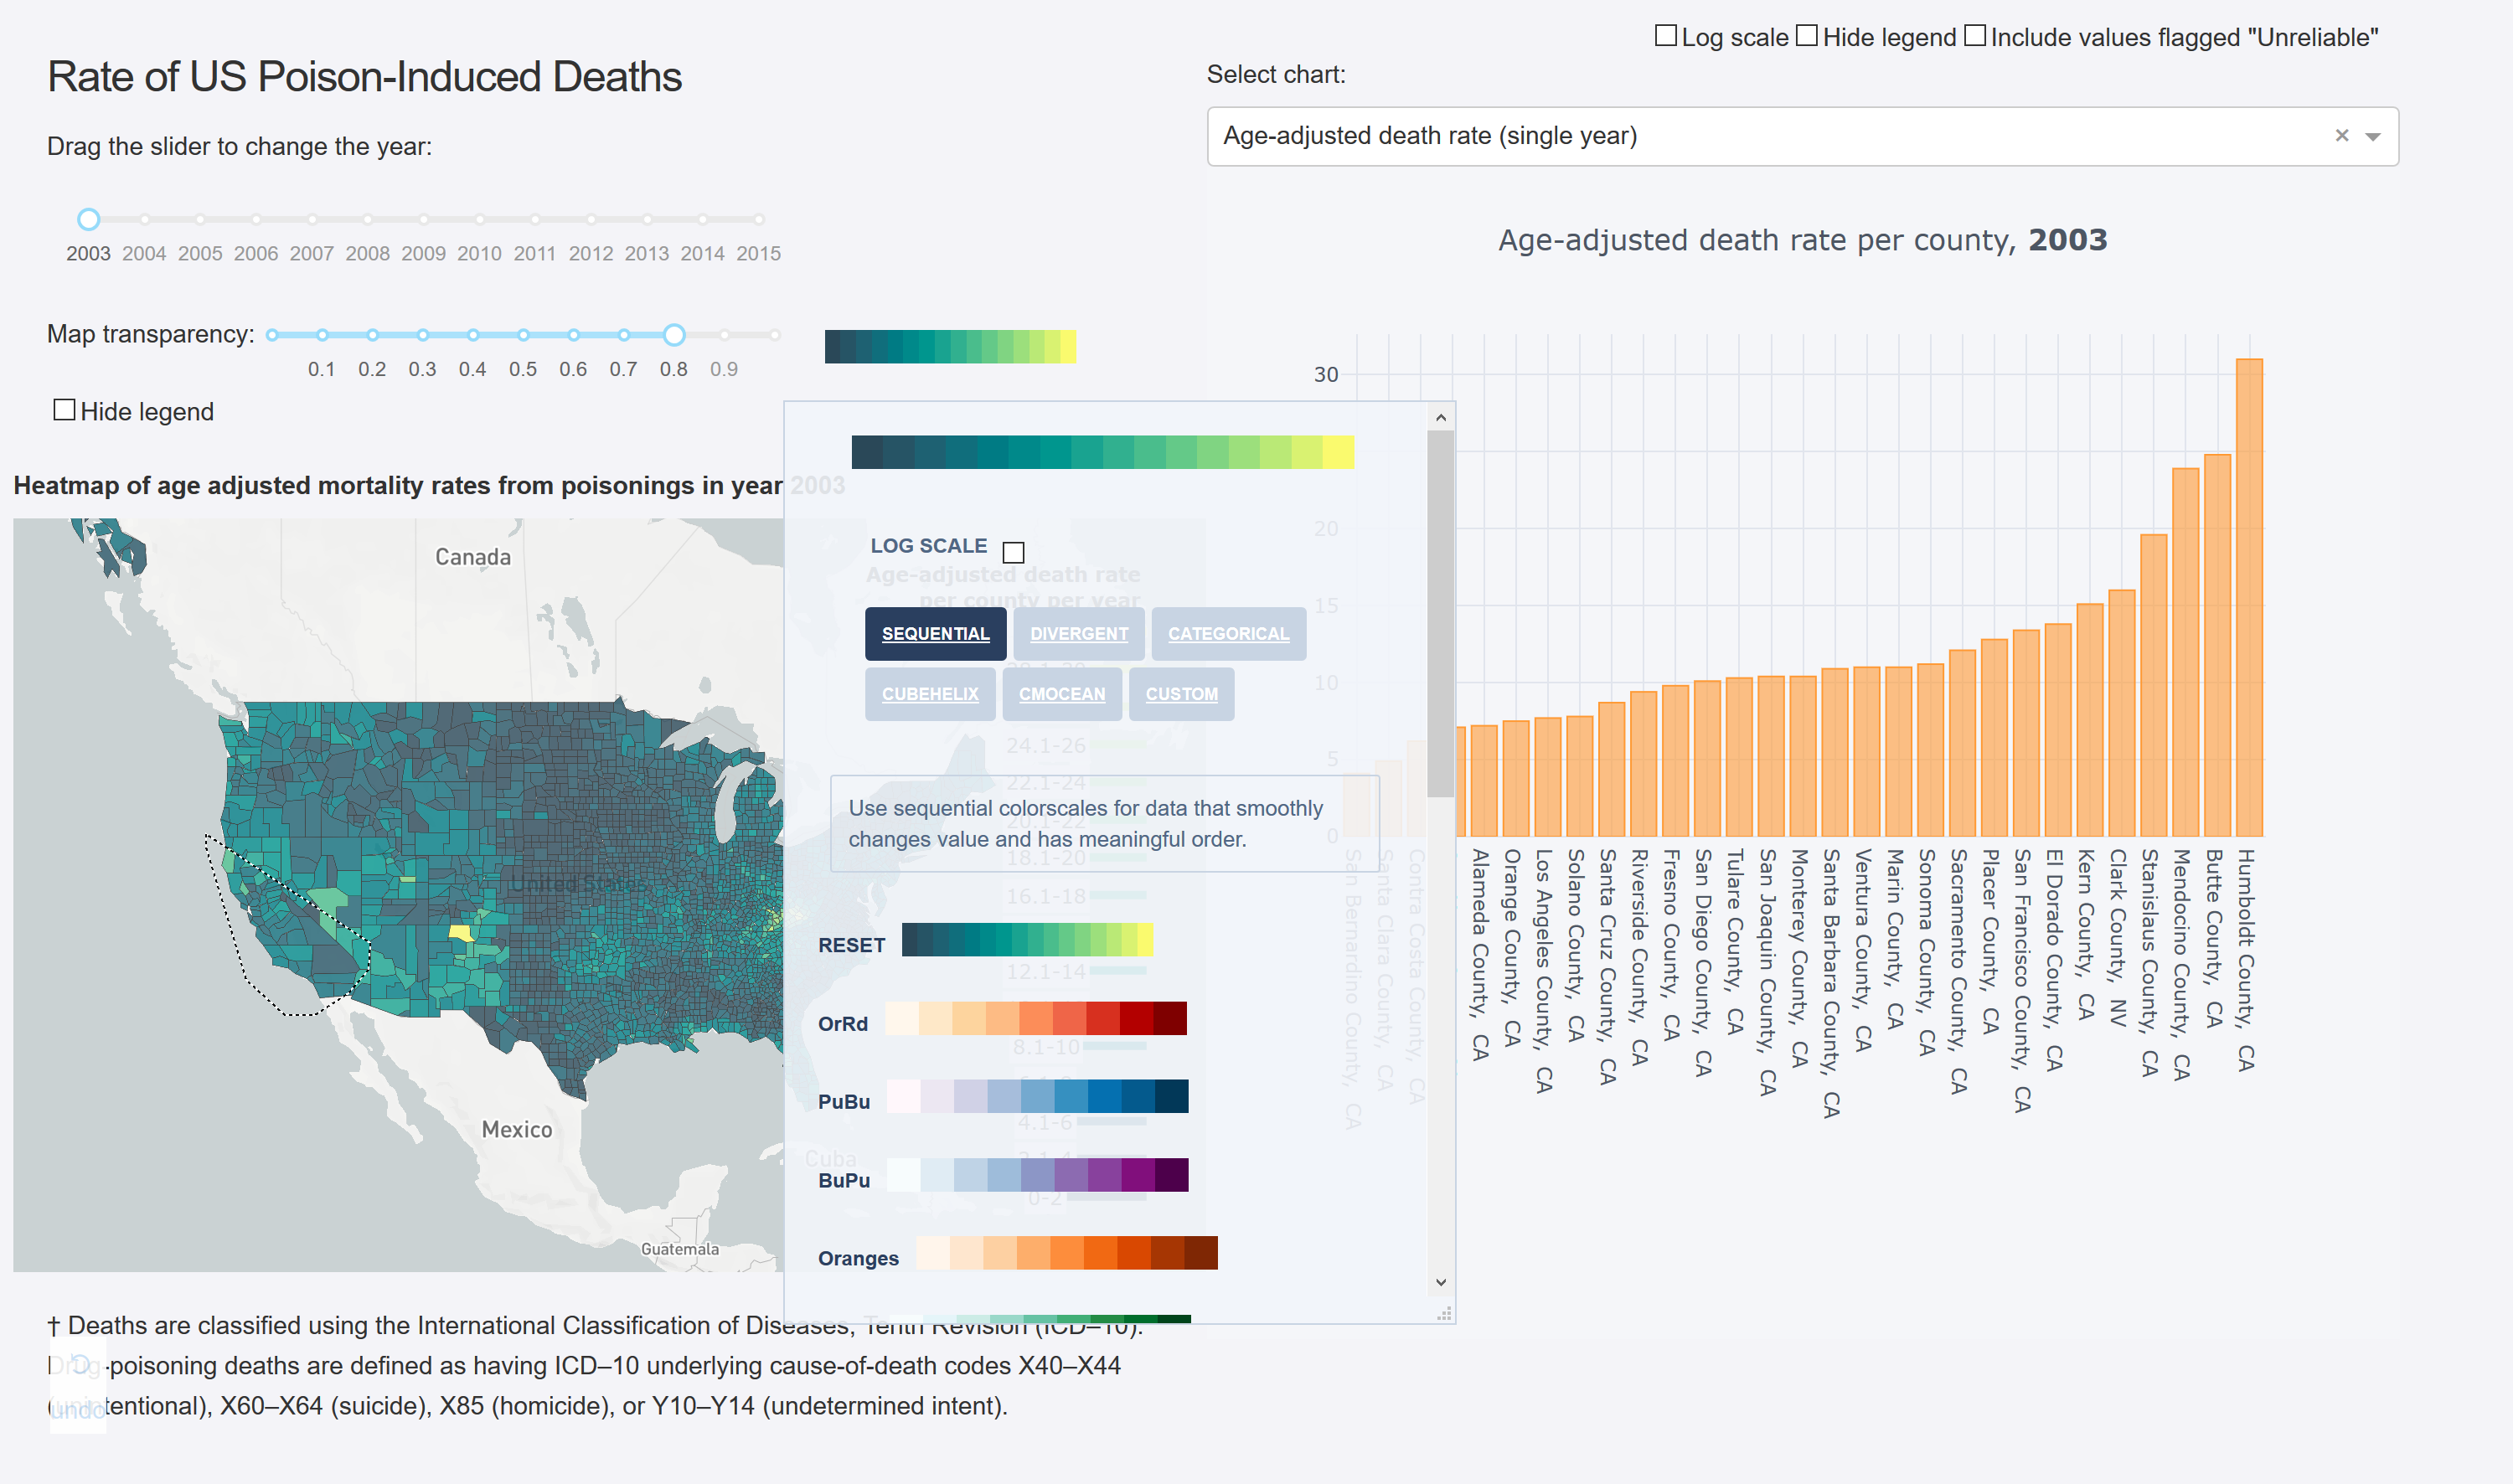
This Dash app shows over a decade of U.S. county-level data for exploration, and was written in less than 400 lines of Python code. You’ll see that each interaction with the sliders, map, graph, colorbar, and dropdown automatically updates the rest of the app’s features.
Start exploring: https://opioid-epidemic.herokuapp.com/
9. VISUALIZE MACHINE LEARNING
If you’re using machine learning to sharpen your business intelligence, an accurate model is everything. This Dash app visualizes accuracy and loss, two key factors when training your model. The real-time feedback is extremely useful, and it’s possible because Dash’s Python interface integrates so well with unstructured data and analytical code.
See how it works: https://dash-gallery.plotly.host/dash-live-model-training
10. NATURAL LANGUAGE PROCESSING
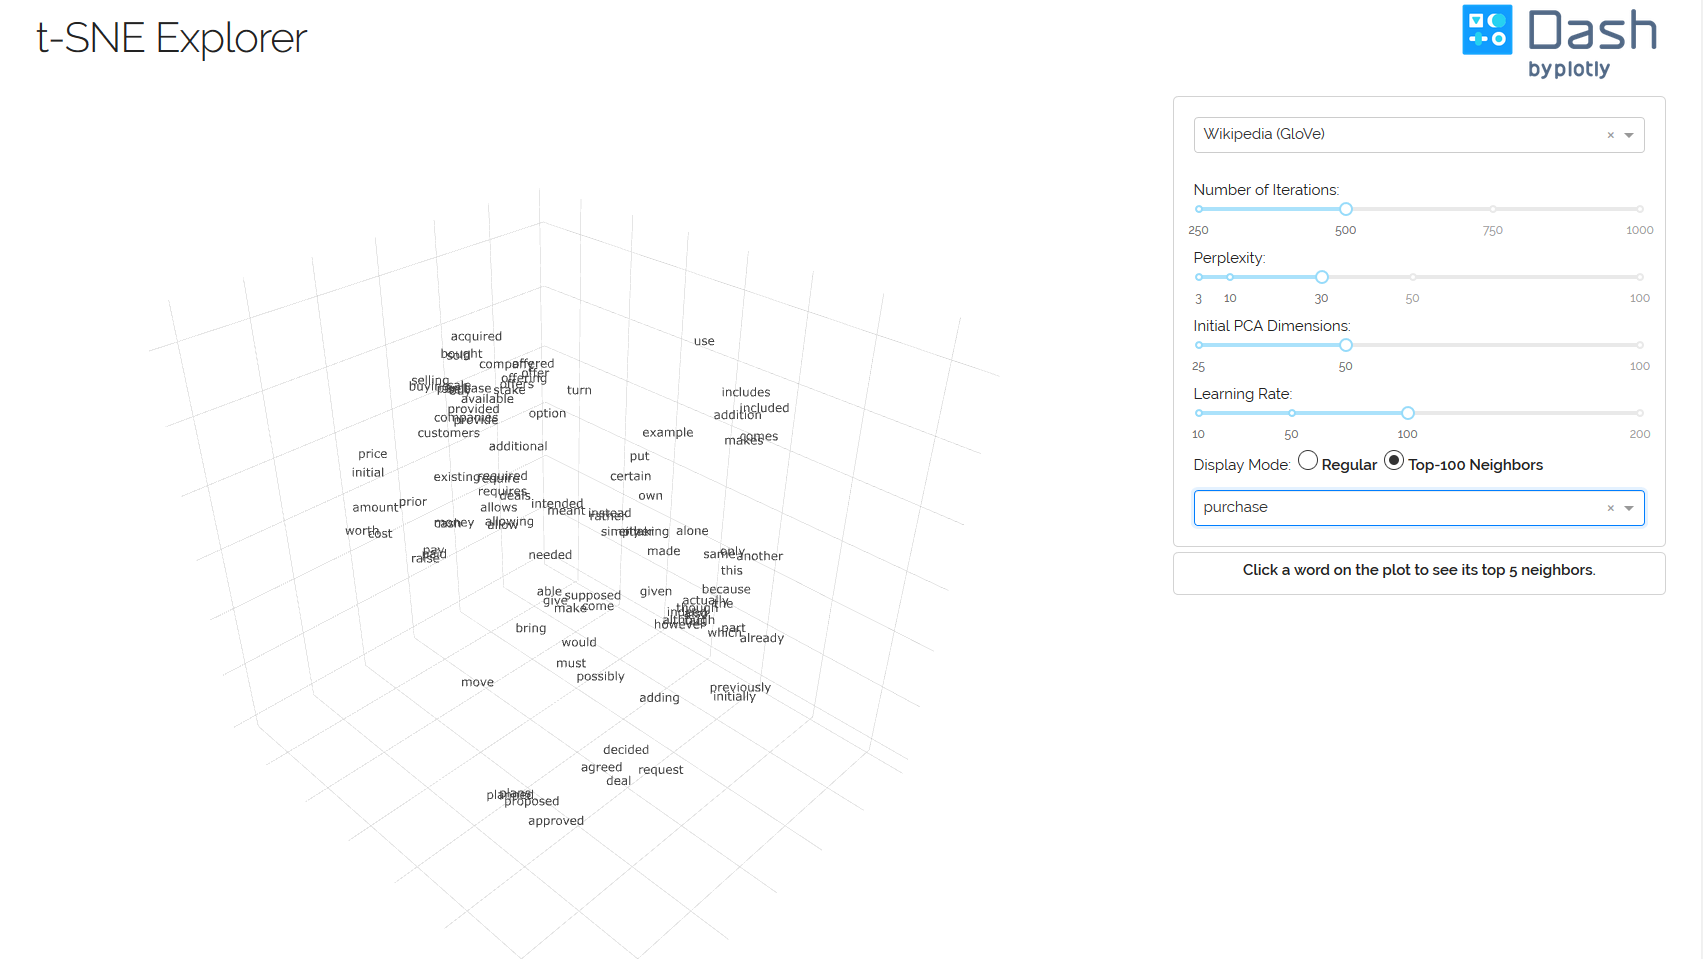
Speaking of machine learning, if you’re using it for natural language processing, you may be interested in word embeddings. This Dash app maps how often words appear near each other in a text, with regards to how often they are used.
Try it yourself and get the technical details here: https://dash-gallery.plotly.host/dash-tsne
Want to learn more about any of these featured Dash applications or components? Contact our sales team to schedule a demo or get started making your own.