Below are 13 charts made in Plotly or using Ploty’s APIs by users on Outer Space, Satellites and Astrophysics
1. Flybys of Minor Planets, Pioneer 10 and 11, Voyager I and II, and New Horizons
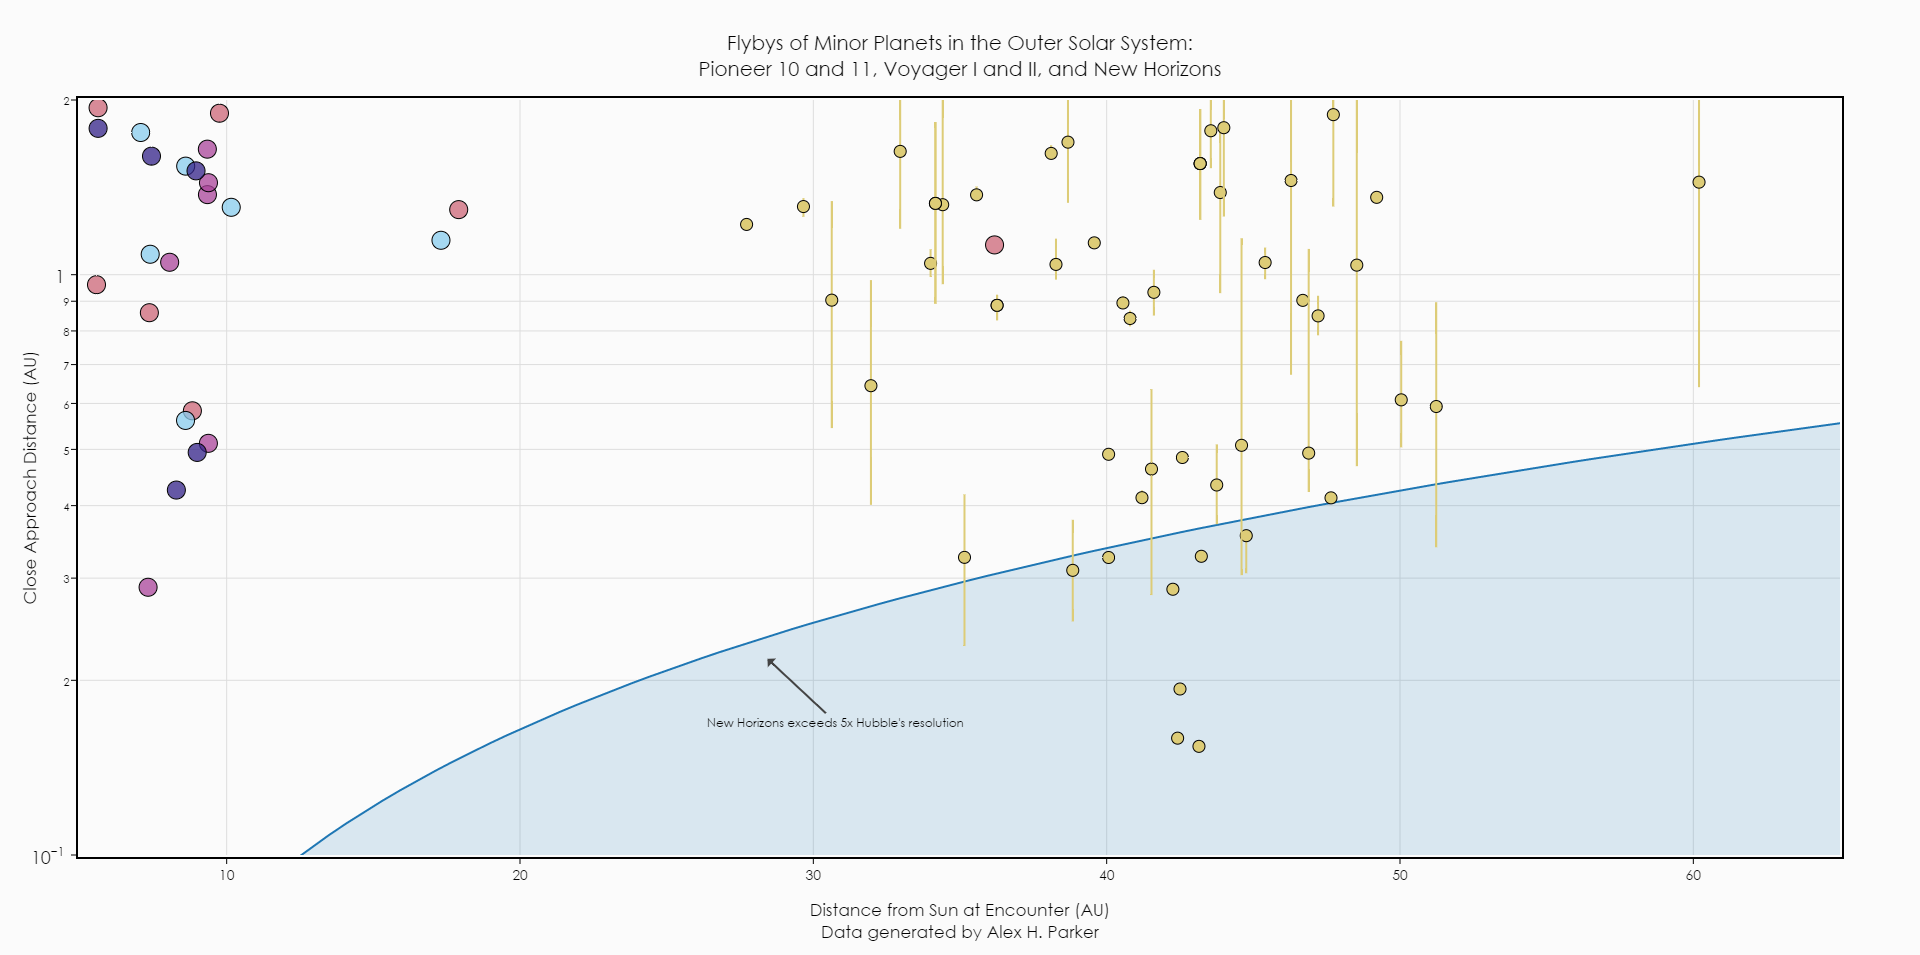
Chart Link: https://plot.ly/~alexhp/57/flybys-of-minor-planets-in-the-outer-solar-system-pioneer-10-and-11-voyager-i-an/
Chart Author: @ alexhp
Touched up in: Plotly online editor
Code: Python code R Code
2. Vermont Lunar CubeSat
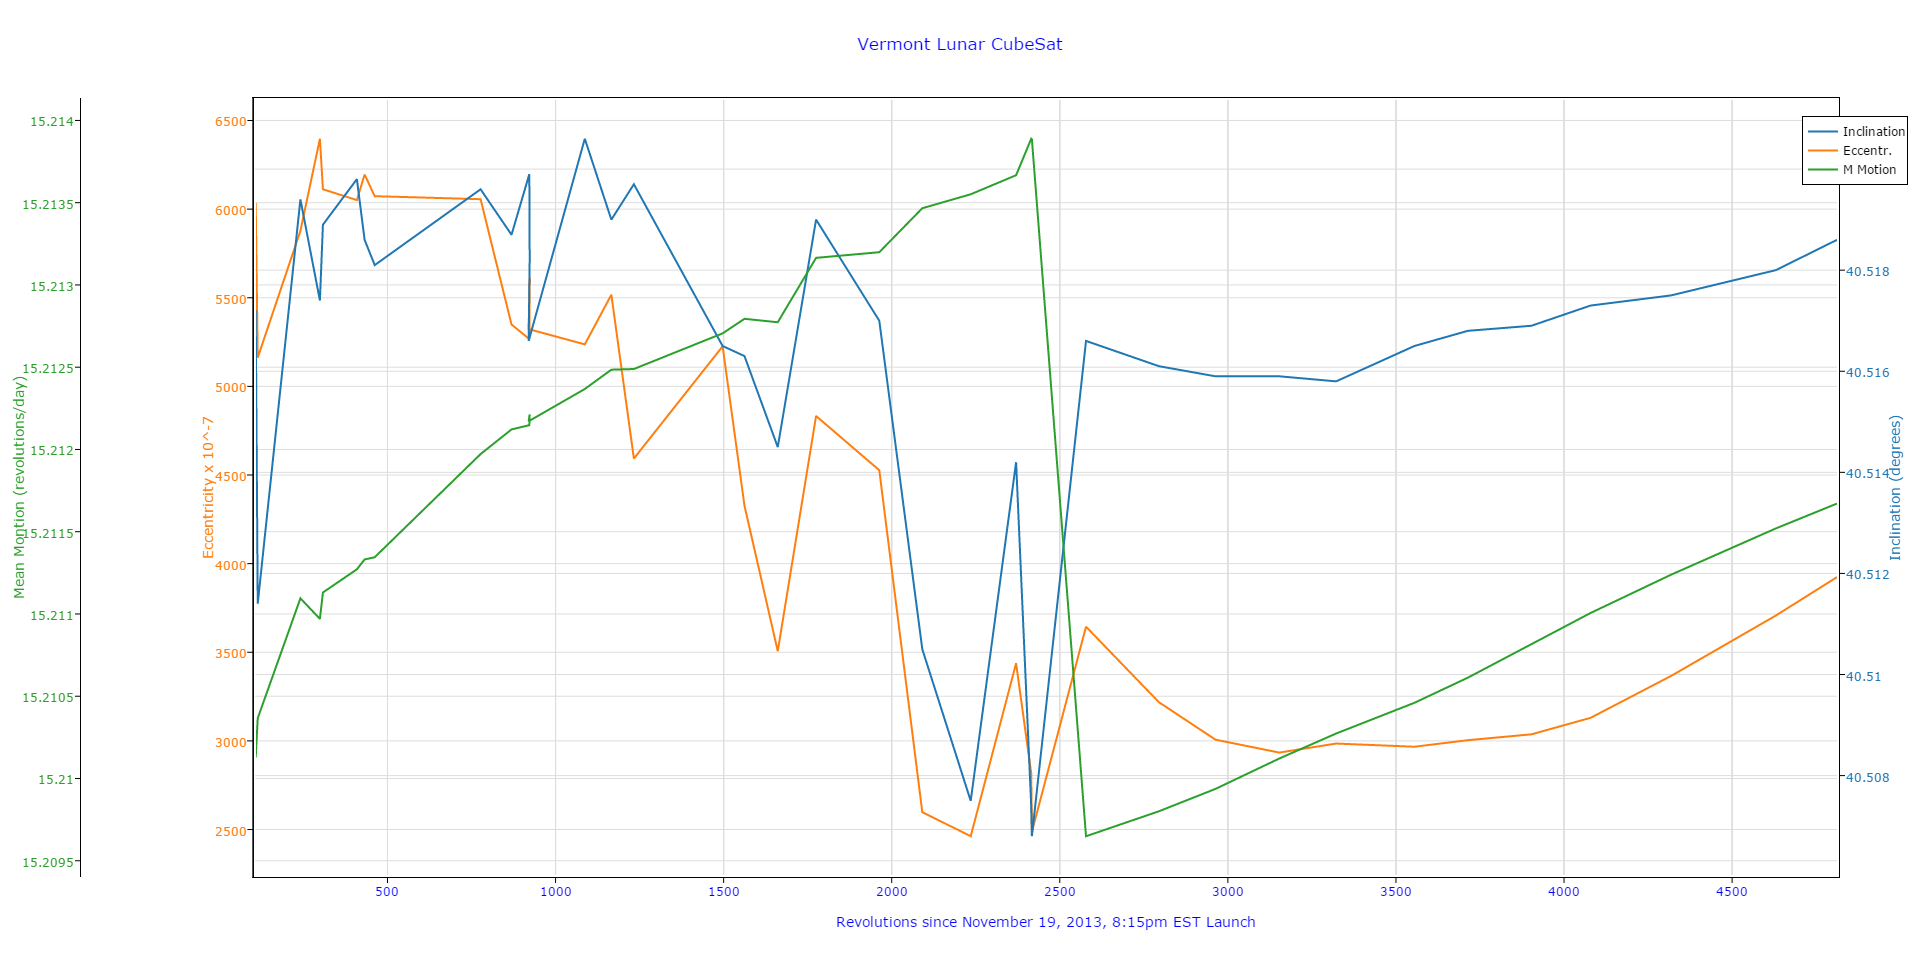
Chart Link: https://plot.ly/~cbrandon/7/vermont-lunar-cubesat/
Chart Author: @ cbrandon
Touched up in: Plotly online editor
Code: Python code R Code
3. A Century of Asteroid Flybys
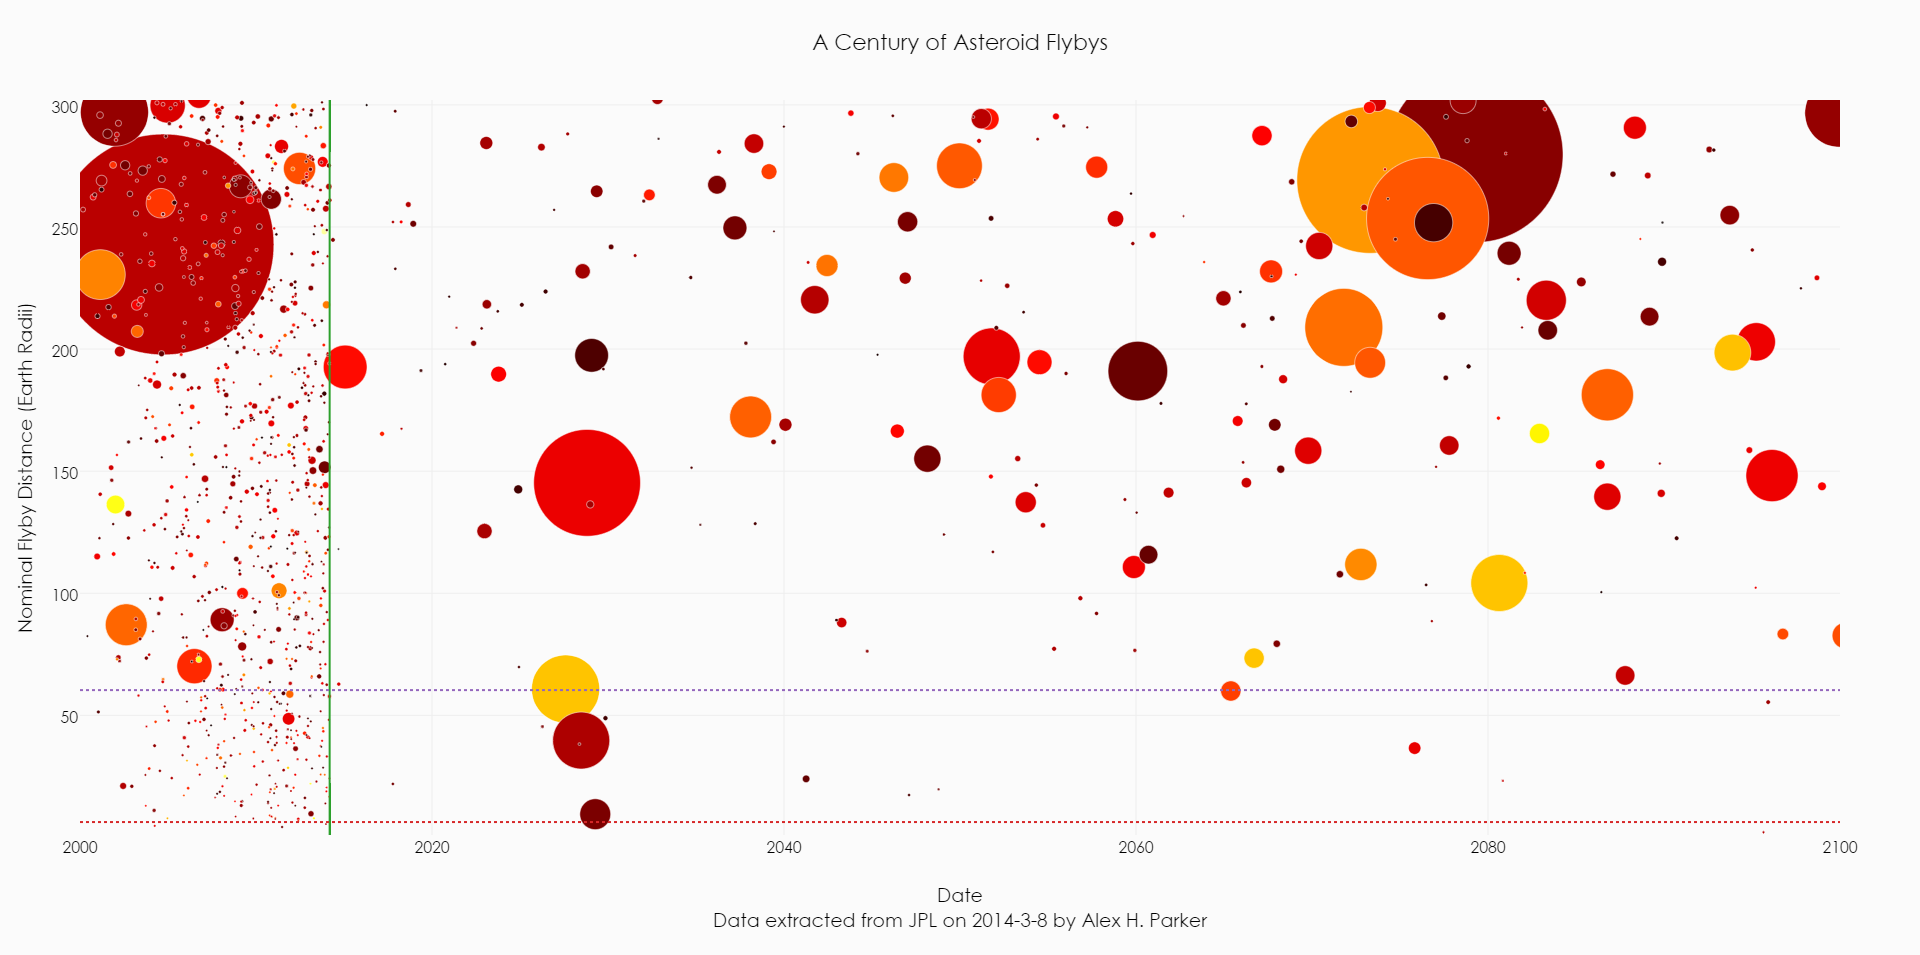
Chart Link: https://plot.ly/~alexhp/68/a-century-of-asteroid-flybys/
Chart Author: @ alexhp
Touched up in: Plotly online editor
Code: Python code R Code
4. Halo Distribution
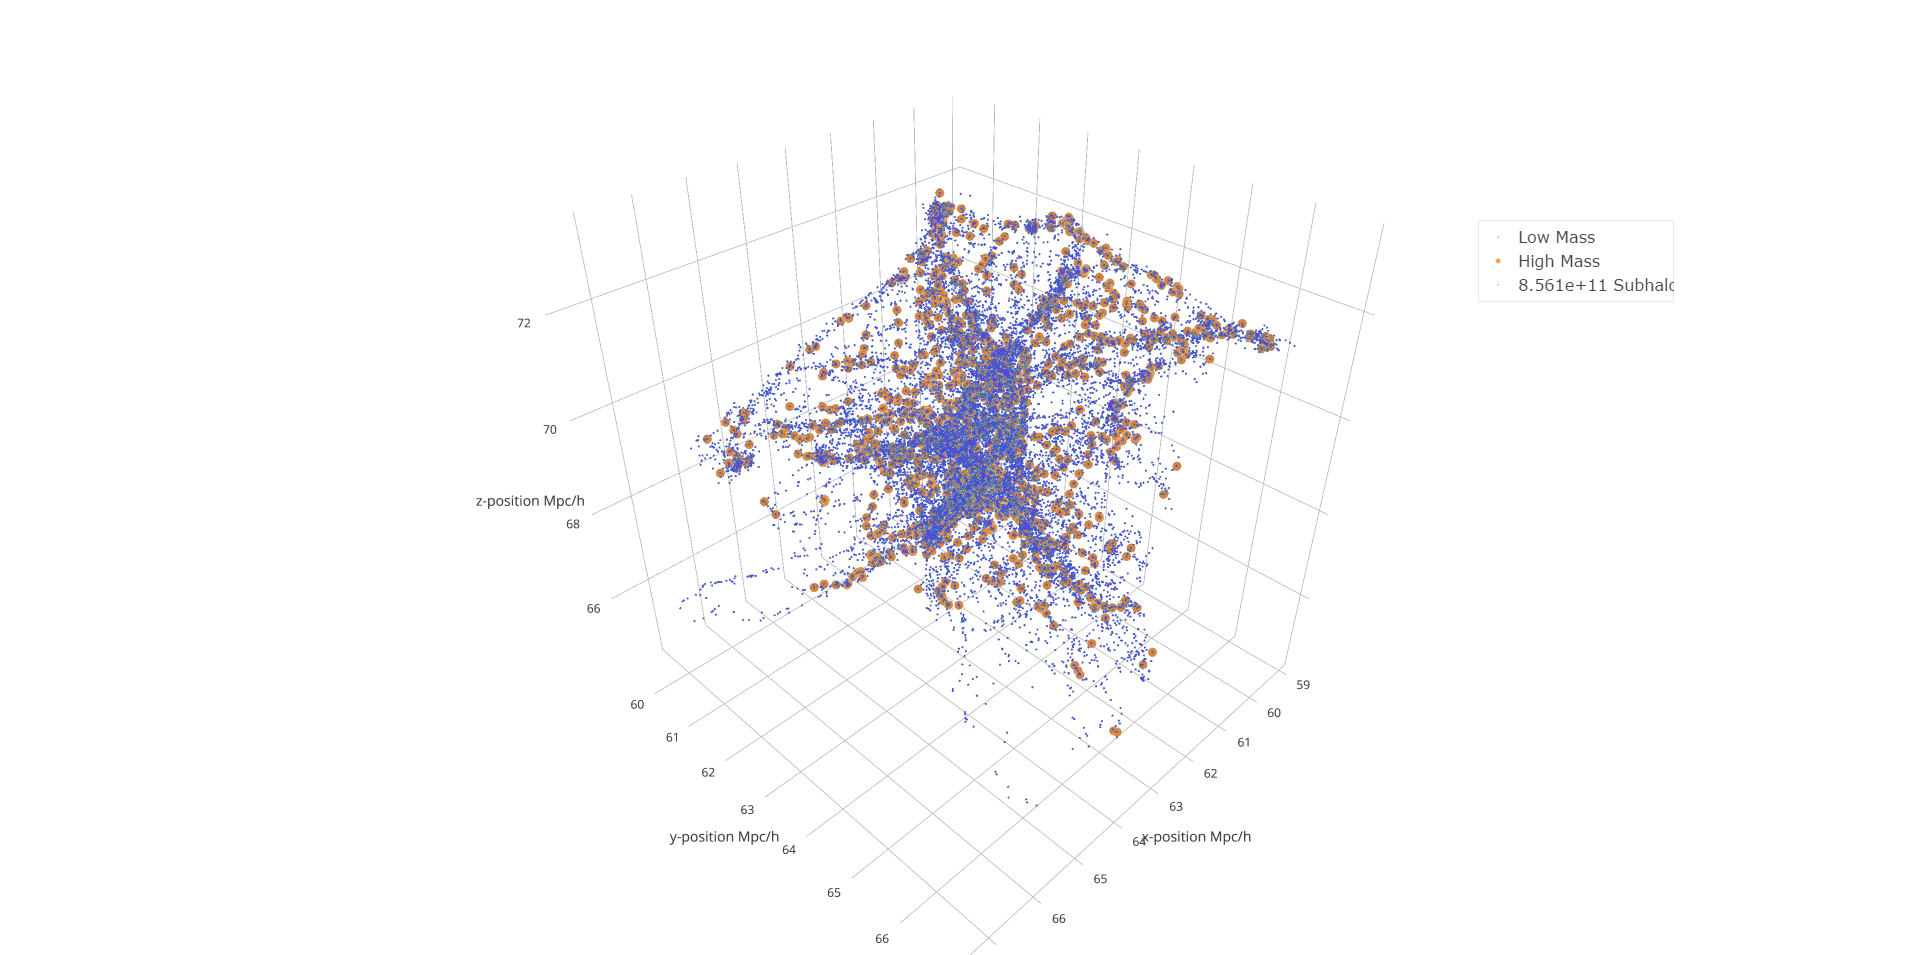
Chart Link: https://plot.ly/~Cat_Phish/8/halo-distribution/
Chart Author: @ Cat_Phish
Touched up in: Plotly online editor
Code: Python code R Code
5. Mean CVF of Subhalos
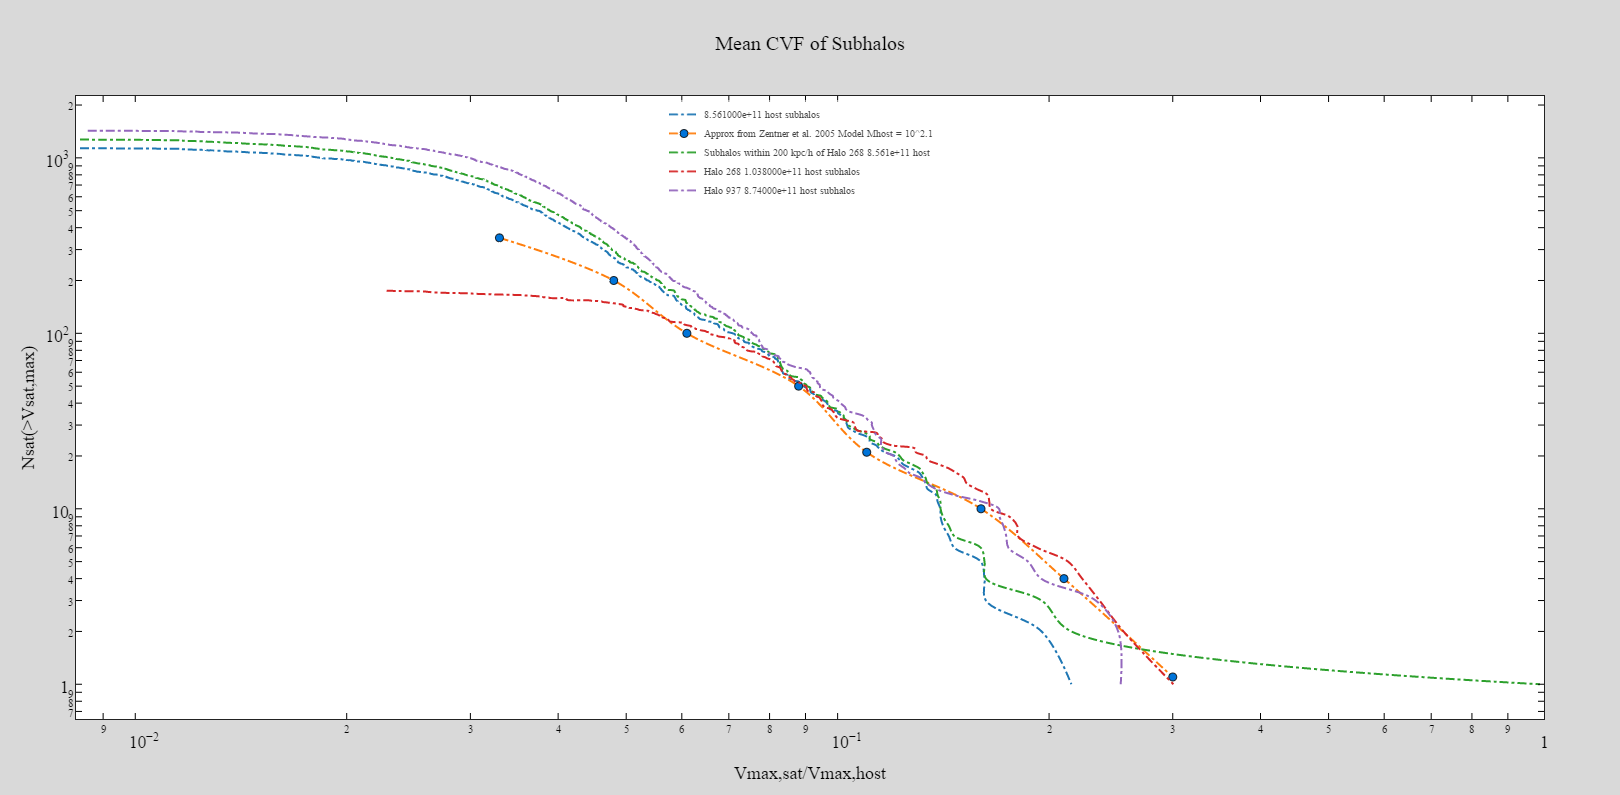
Chart Link: https://plot.ly/~Cat_Phish/330/mean-cvf-of-subhalos/
Chart Author: @ Cat_Phish
Touched up in: Plotly online editor
Code: Python code R Code
6. Star Wars API – Spaceships
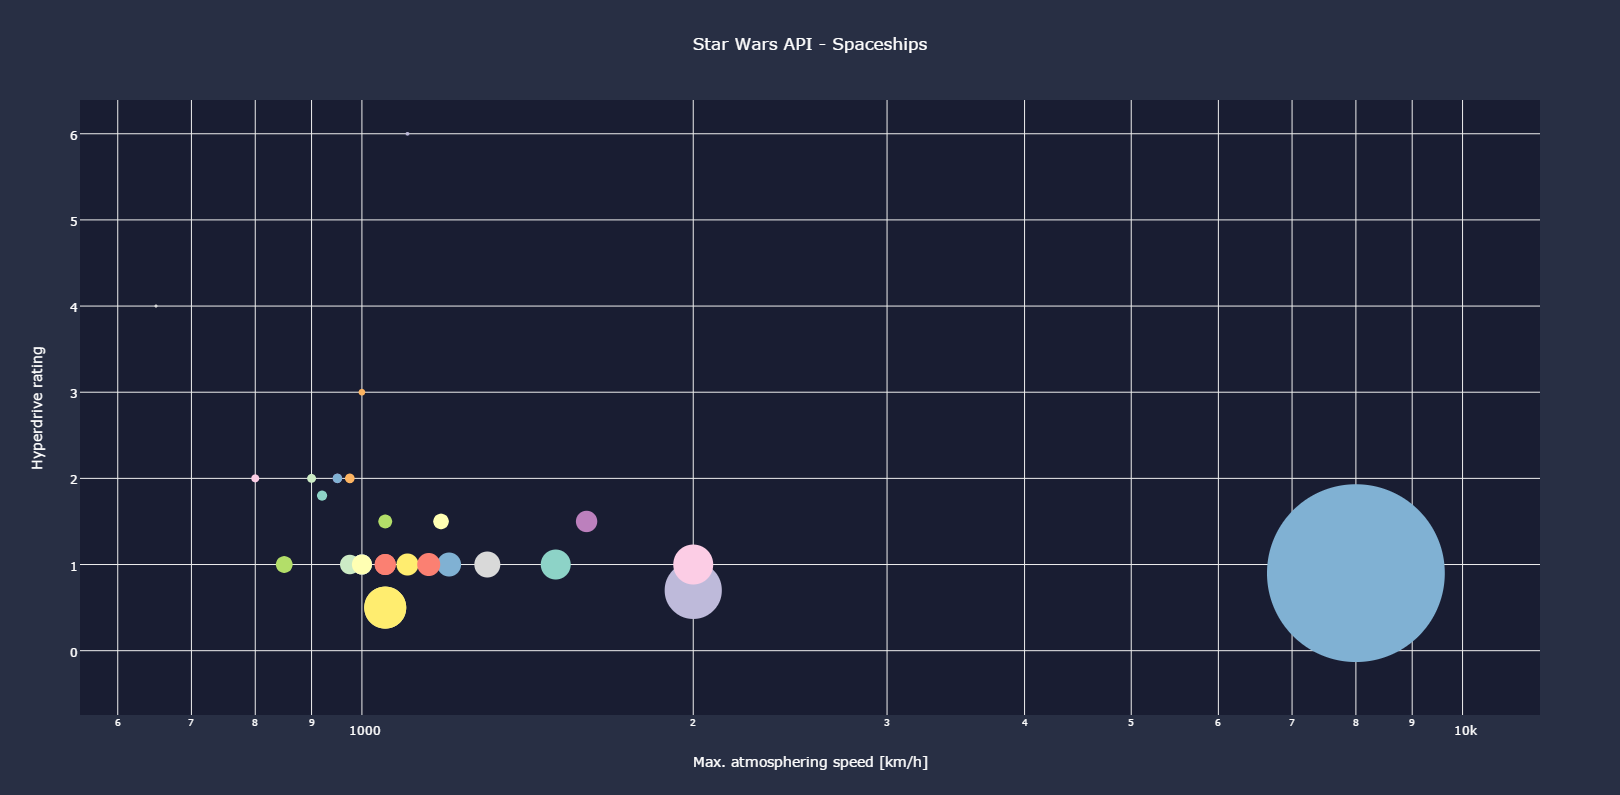
Chart Link: https://plot.ly/~tcmoran/47/star-wars-api-spaceships/
Chart Author: @ tcmoran
Touched up in: Plotly online editor
Code: Python code R Code
7. Planets – Temparature, Gravity, Density and Distance from the sun
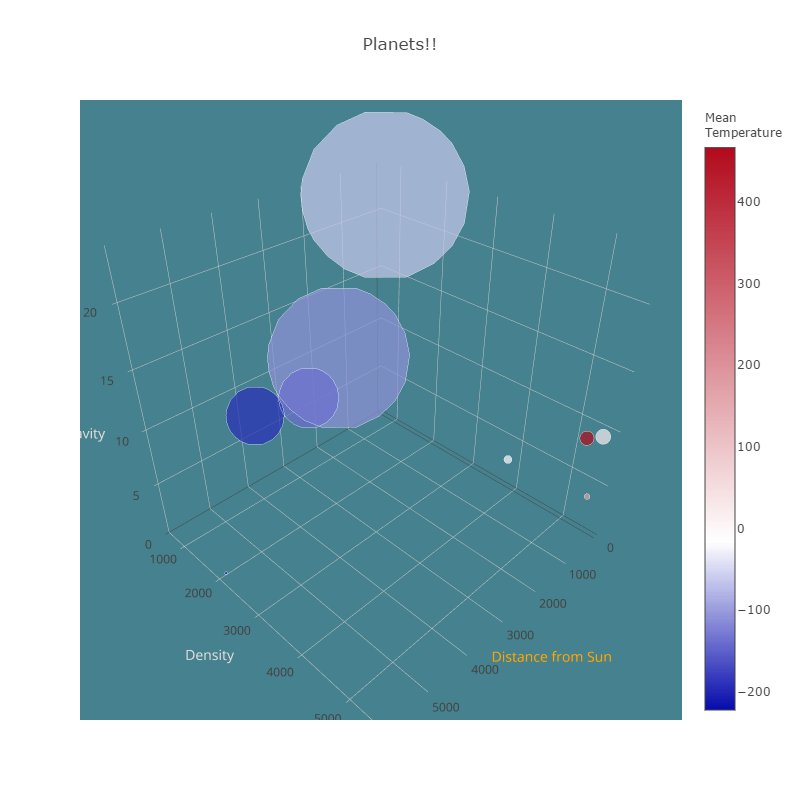
Chart Link: https://plot.ly/~chelsea_lyn/8796/planets/
Chart Author: @ chelsea_lyn
Touched up in: Plotly online editor
Code: Python code R Code
8. Flight plan update
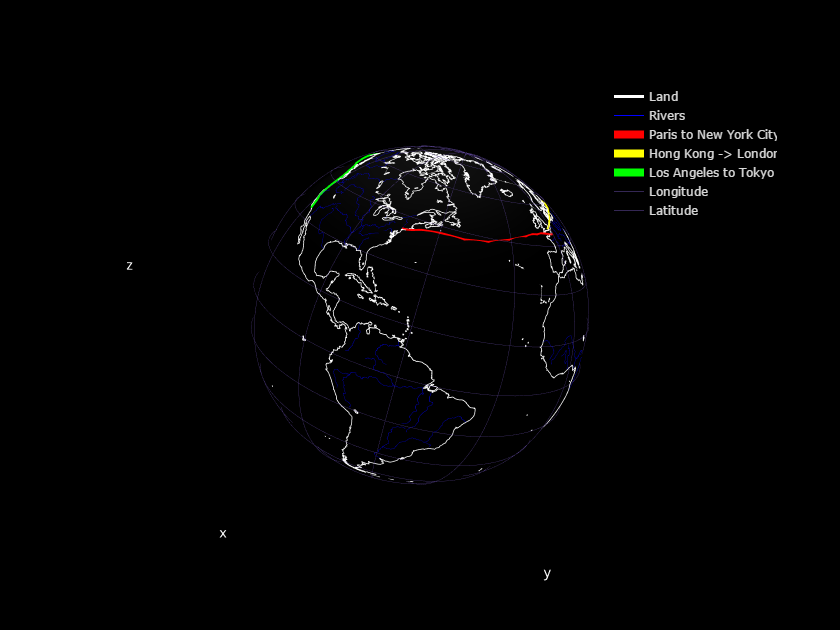
Chart Link: https://plot.ly/~chelsea_lyn/1936/
Chart Author: @ chelsea_lyn
Touched up in: Plotly online editor
Code: Python code R Code
9. Early HR Benchmarks
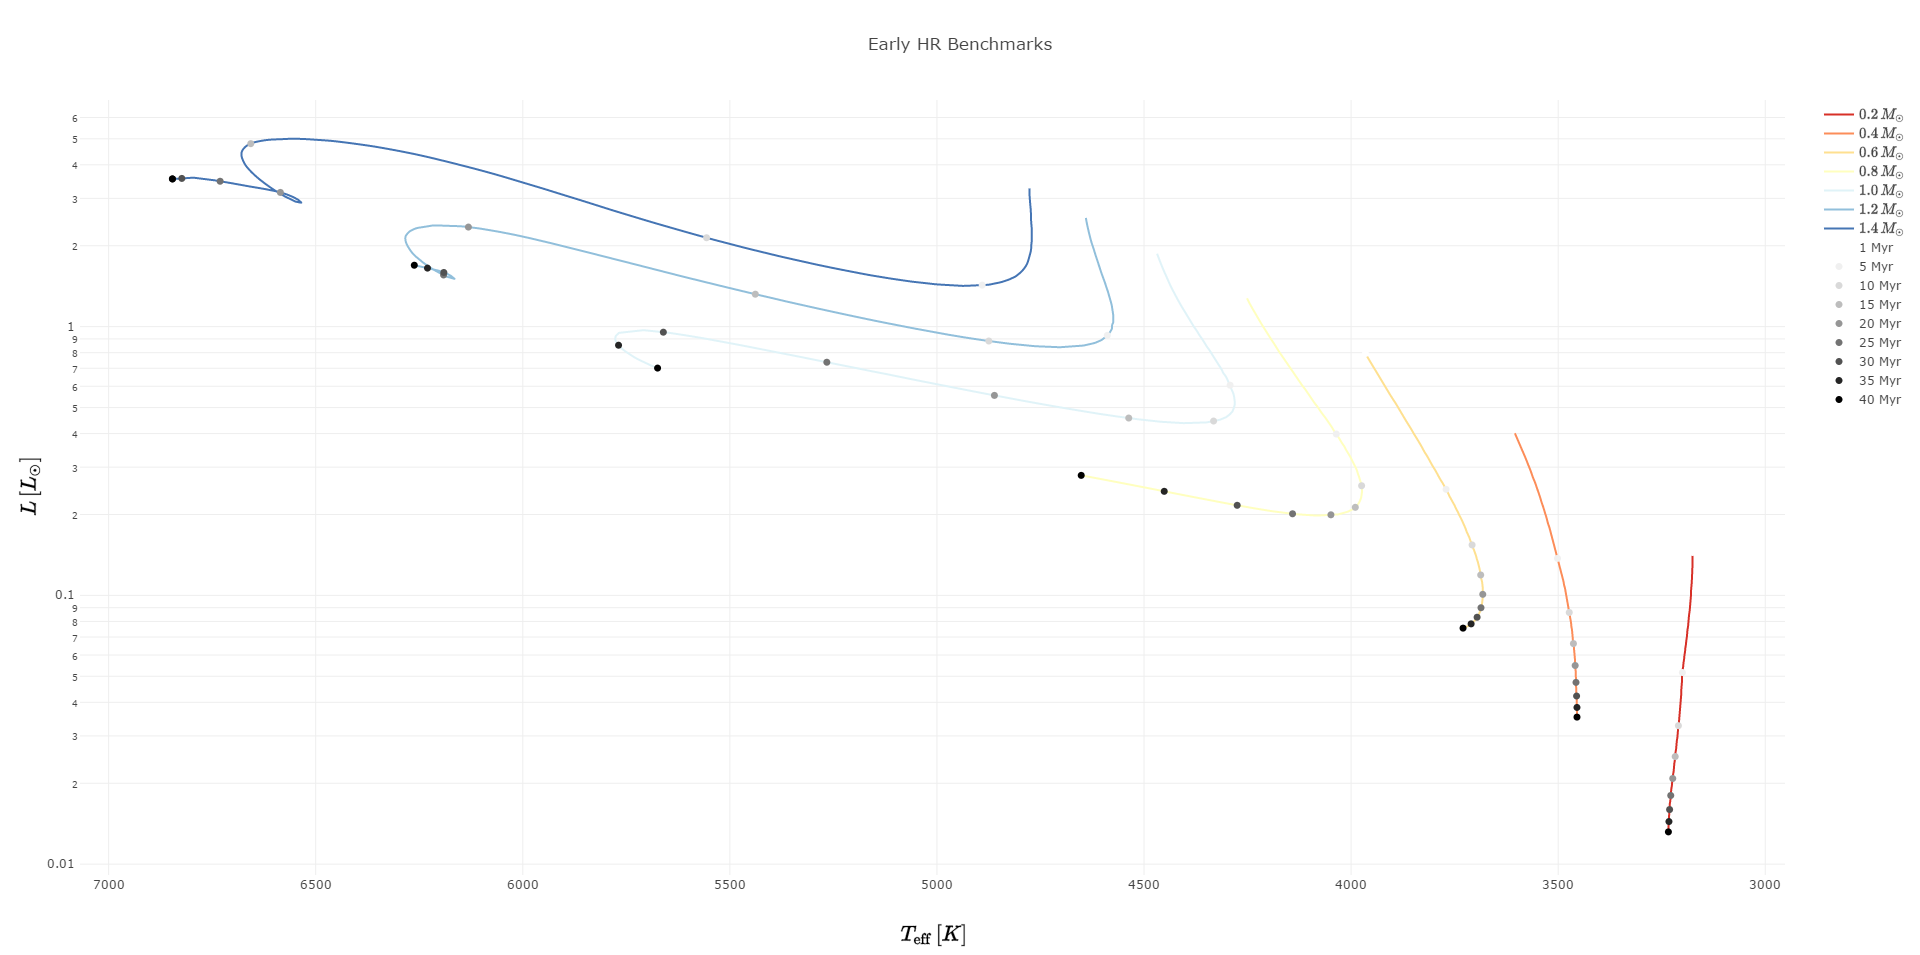
Chart Link: https://plot.ly/~iancze/82/early-hr-benchmarks/
Chart Author: @ iancze
Touched up in: Plotly online editor
Code: Python code R Code
10. MWC758
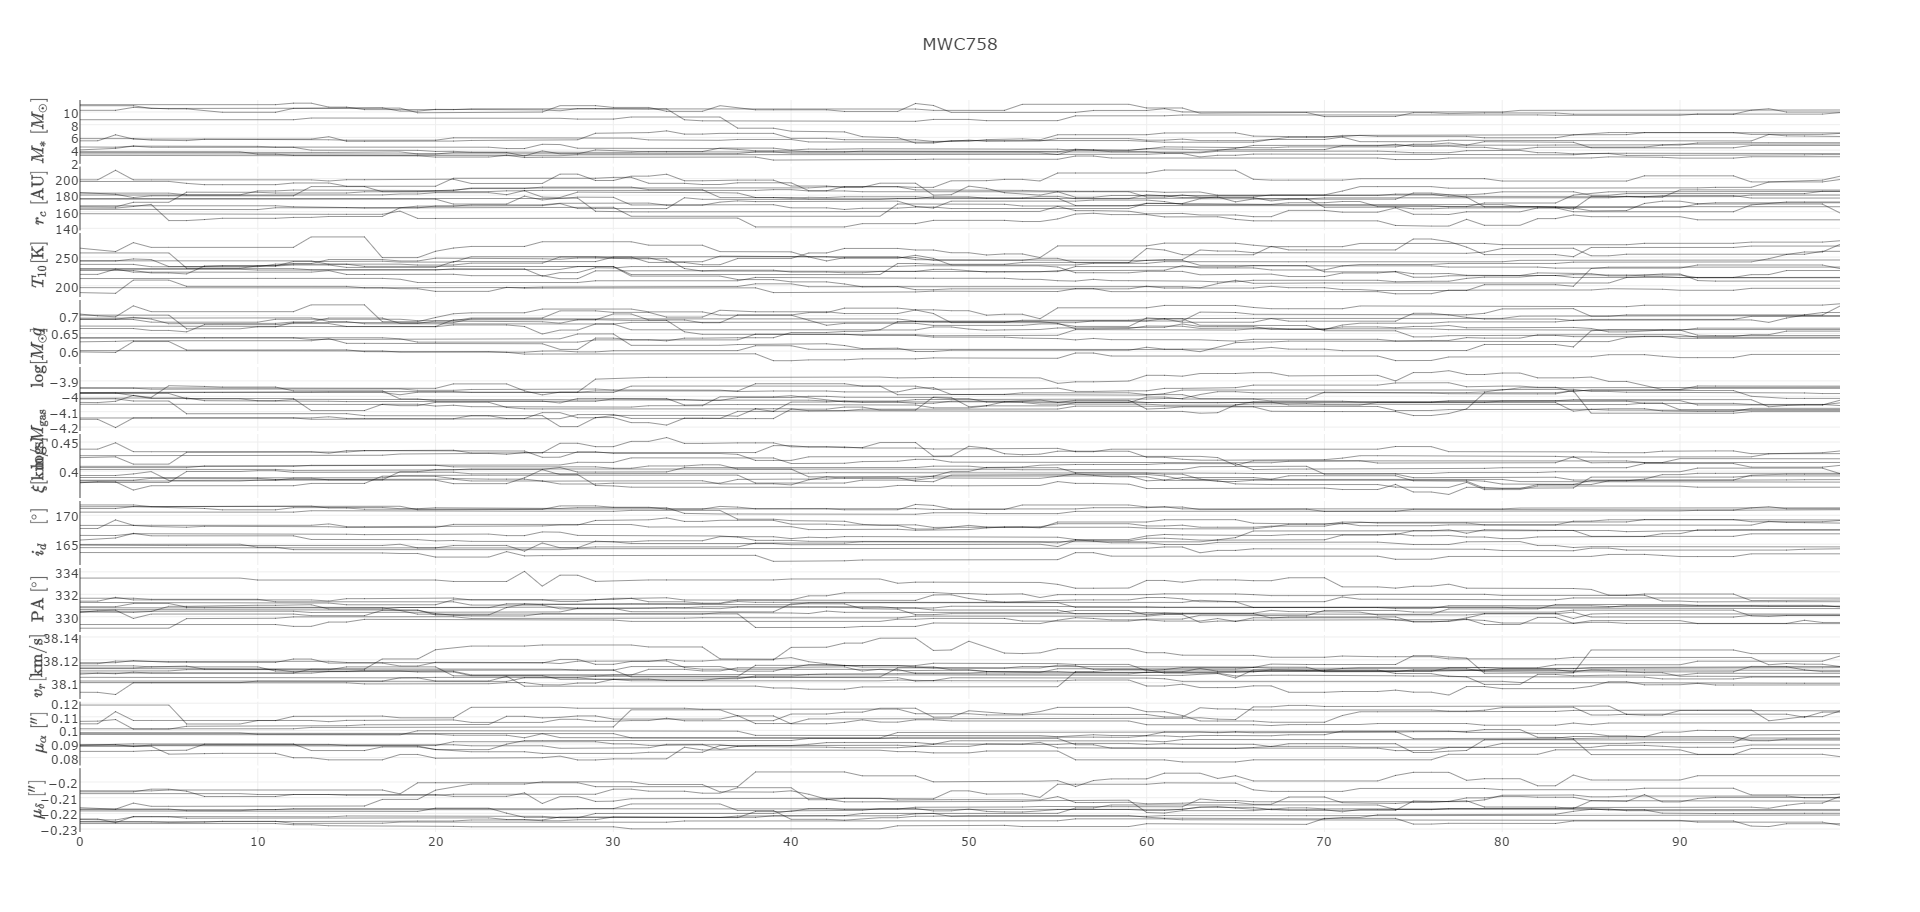
Chart Link: https://plot.ly/~iancze/150/mwc758/
Chart Author: @ iancze
Touched up in: Plotly online editor
Code: Python code R Code
11. Artifical Gravity for Spacecrafts
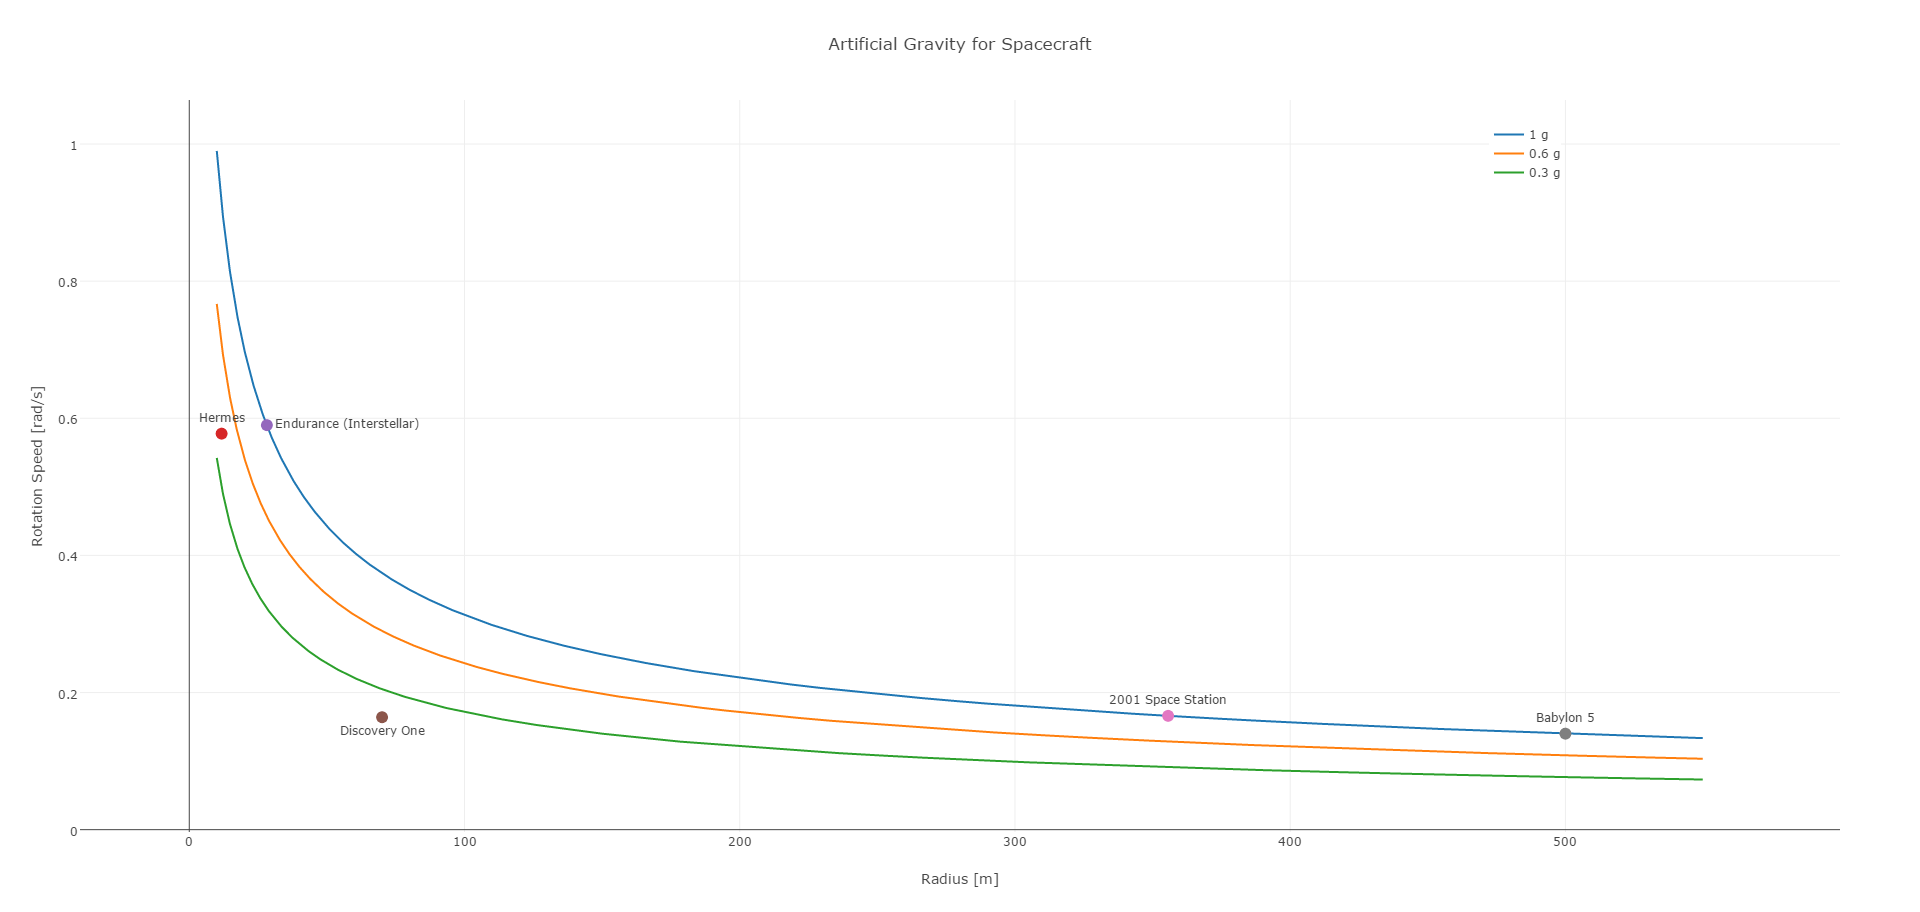
Chart Link: https://plot.ly/~RhettAllain/1163/artificial-gravity-for-spacecraft/
Chart Author: @ RhettAllain
Touched up in: Plotly online editor
Code: Python code R Code
12. Stacked M-Dwarf Spectra (14 Stars with log g > 1.5)
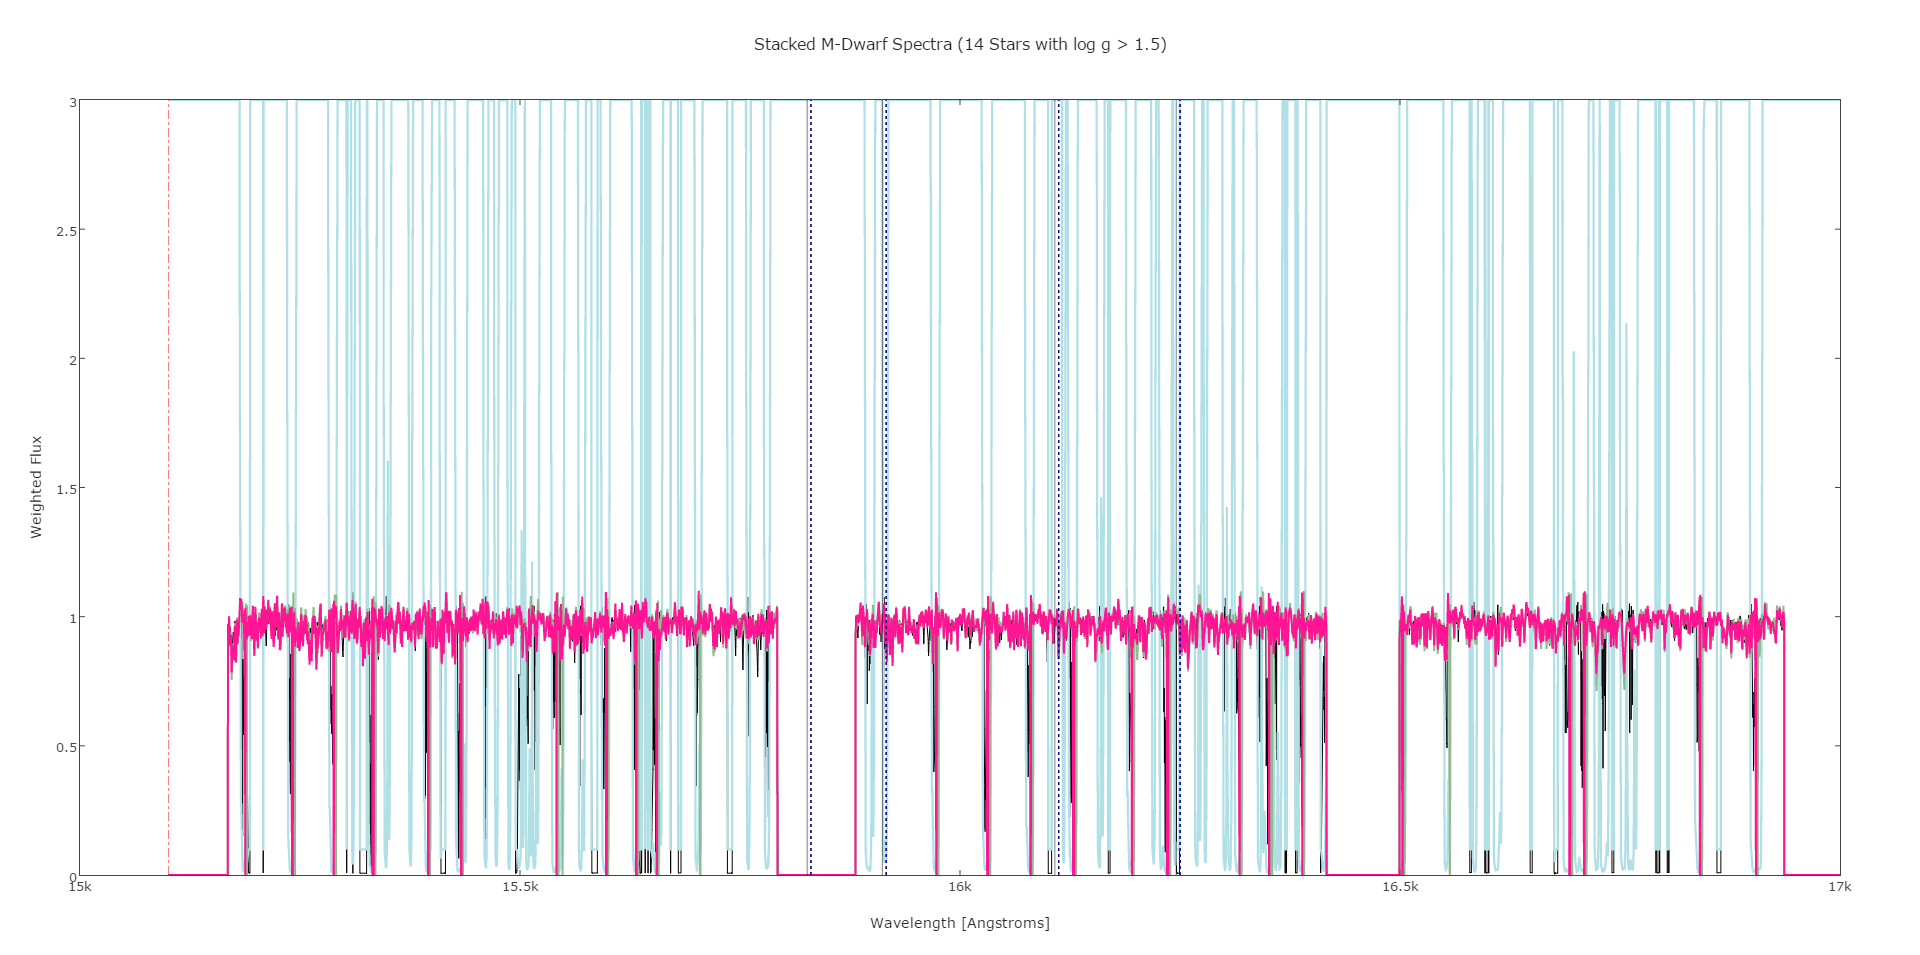
Chart Link: https://plot.ly/~msoaresfurtado/239/
Chart Author: @ msoaresfurtado
Touched up in: Plotly online editor
Code: Python code R Code
13. NASA declining Planetary Exploration
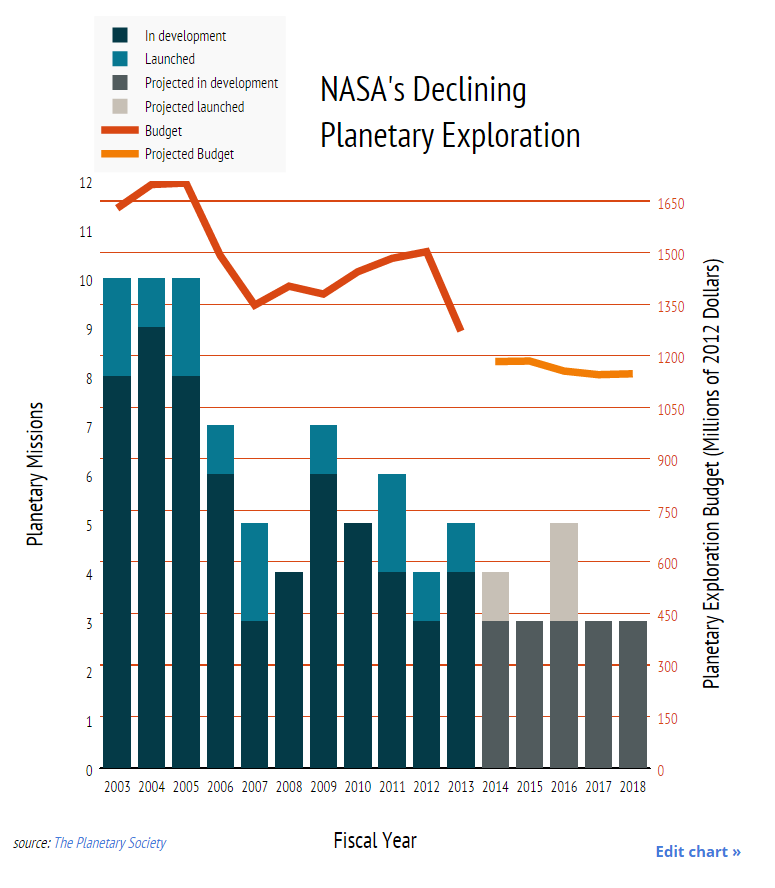
Chart Link: https://plot.ly/~bchartoff/919/planetary-missions-vs-fiscal-year/
Chart Author: @ bchartoff
Touched up in: Plotly online editor
Code: Python code R Code