This is the second post in our Lego Miniseries, a 10 part mini-bonanza on augmenting your existing BI investment with Plotly’s online, collaborative, and exploratory visual analytics platform.
Our second post is about using Plotly and Tableau together. BI enterprise platforms are powerful once they are set up, but they are undeniably expensive and can be time-consuming for IT to configure. Plotly offers an agile “middle way” with its online platform, which can be used synergistically with leading BI products like Tableau.
Want to learn more about using Plotly as a BI platform? Schedule a demo with our sales team.
Tableau is an amazing product and company. We see lots of customers like Tesla Motors and King Games use Tableau alongside Plotly. But sometimes analysts need to work outside the typical BI box – you might need for example:
- A scripting language like R or Python for advanced analytics or statistical problem solving.
- Advanced types of maps or charts that do not come with Tableau.
- Connections to advanced data sources like Elasticsearch and Parquet files.
- A way to make a quick chart or dashboard online, when at a computer where a Tableau license is not installed.
Serving a slightly more technical user is where Plotly really shines. To this end, Plotly features:
- World-class R and Python support for dashboards and charts.
- An open, comprehensive REST API for dashboards, chart, and file management.
- Advanced chart and map types that are common in products like SAS, MATLAB, and ESRI.
- An open-source database connection app where you can contribute new connectors through GitHub.
- An installation-free, 100% online experience.
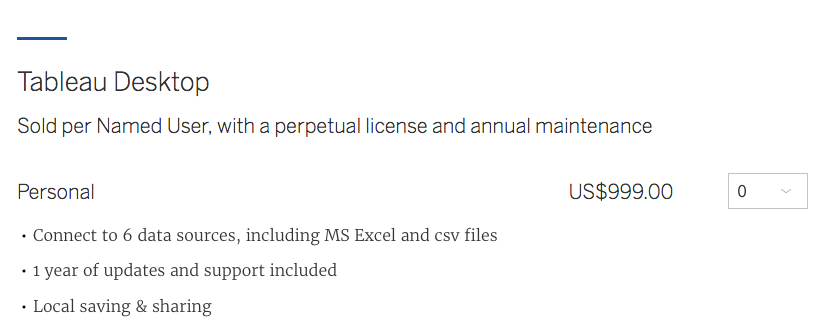
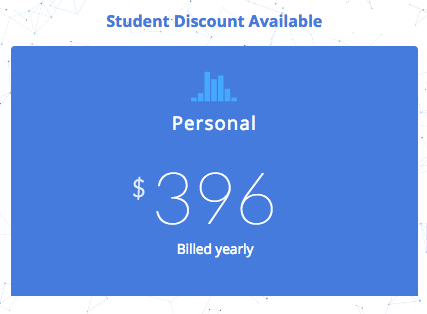
The points above are possible because Plotly is built with 100% web technology. This makes our products cheaper to build and distribute – savings that we can pass onto our customers. For example, Plotly is Free for hosting public data (like Tableau Public), and we we’ve made the entry paid plan for private data 40% the cost of the Tableau entry plan so that you can have both:
TABLEAU PERSONAL IS $999.00
Support is included for first year
PLOTLY PERSONAL IS $396.00/year
See https://plot.ly/products/cloud/
If you’re already using Tableau, it’s easy to embed Plotly visualizations inside Tableau dashboards. Watch Plotly cofounder Matt Sundquist and the head of Tableau Public (Ben Jones) describe how this is done at last year’s PLOTCON:
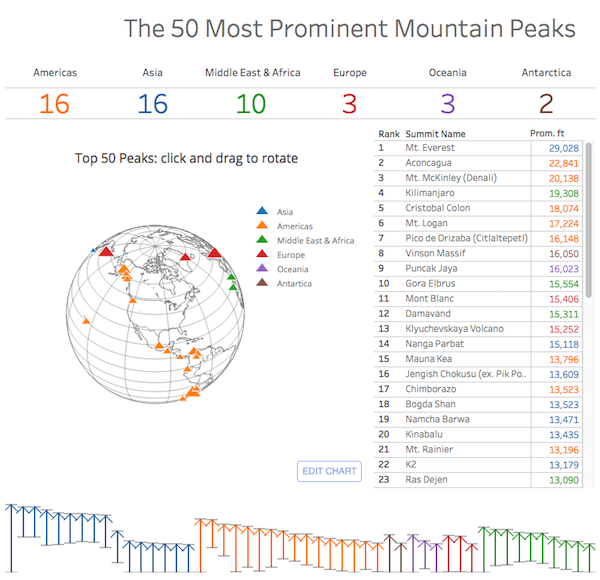
See the Tableau-Plotly fusion dashboard that they created here:
http://dataremixed.com/2016/11/how-to-use-tableau-and-plotly-together/
The globe is a Plotly map embedded in a Tableau dashboard. Click-and-drag to rotate the globe.
The dashboard looks like this:
So, if you’re already using Tableau, try adding Plotly to the mix for agile data visualization, a web-based experience, advanced chart and map types, and interoperability with R, Python, and Tableau dashboards.
Want to learn more about using Plotly as a BI platform? Schedule a demo with our sales team.