7 Interactive Bioinformatics Plots made in Python and R
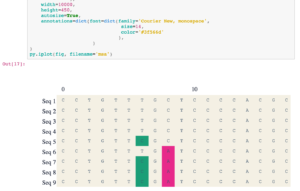
Plotly serves a large bioinformatics and biostats research community. These users leverage the uniquely interactive features of plotly charts for dendrograms, heatmaps, volcano plots, and other visualizations common in this field. Here are 7 resources in Python and R created by plotly bioinformatics and biostats researchers. 1. Jupyter notebook: Visualizing bioinformatics data with plotly and python … Continue reading 7 Interactive Bioinformatics Plots made in Python and R
