Below are 13 charts made in R or Python by Plotly users analyzing election polls or results.
Want to make your own graphs? Get started with Plotly’s free and open-source libraries for R or Python.
1. Sentiment analysis: How Twitter feels about the 2016 US Election Candidates
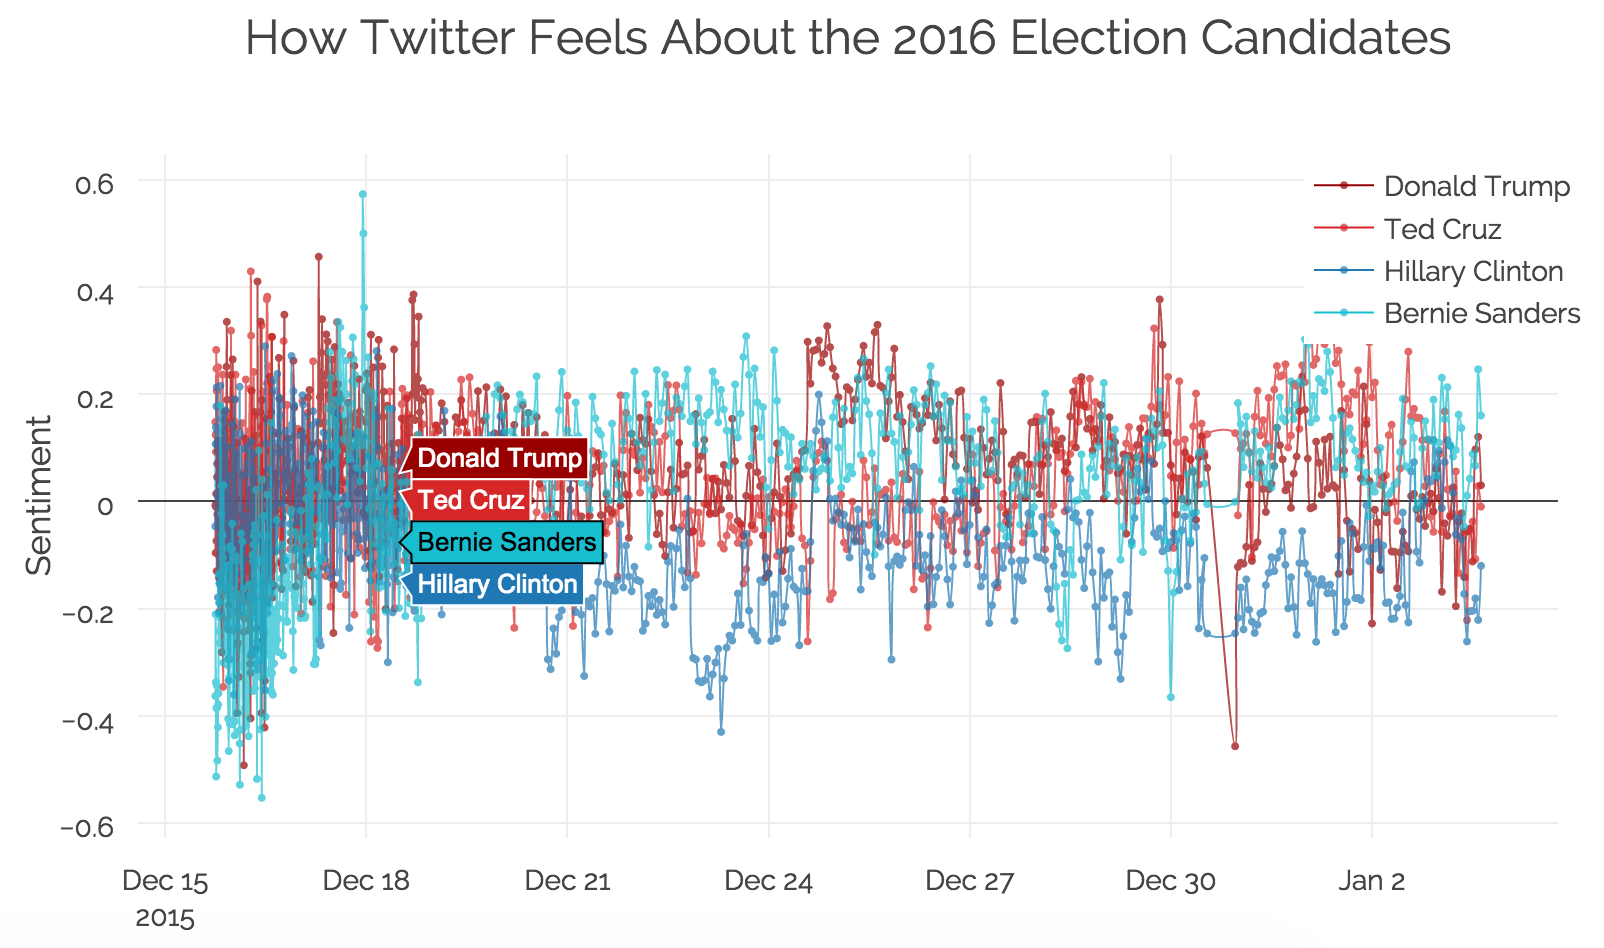
Chart author: @mattybohan
Made in Python.
Python code to make this graph: https://plot.ly/~mattybohan/428.py
R code to make this graph: https://plot.ly/~mattybohan/428.r
2. liar liar pants on fire: how voters feel about Us candidate truthfulness
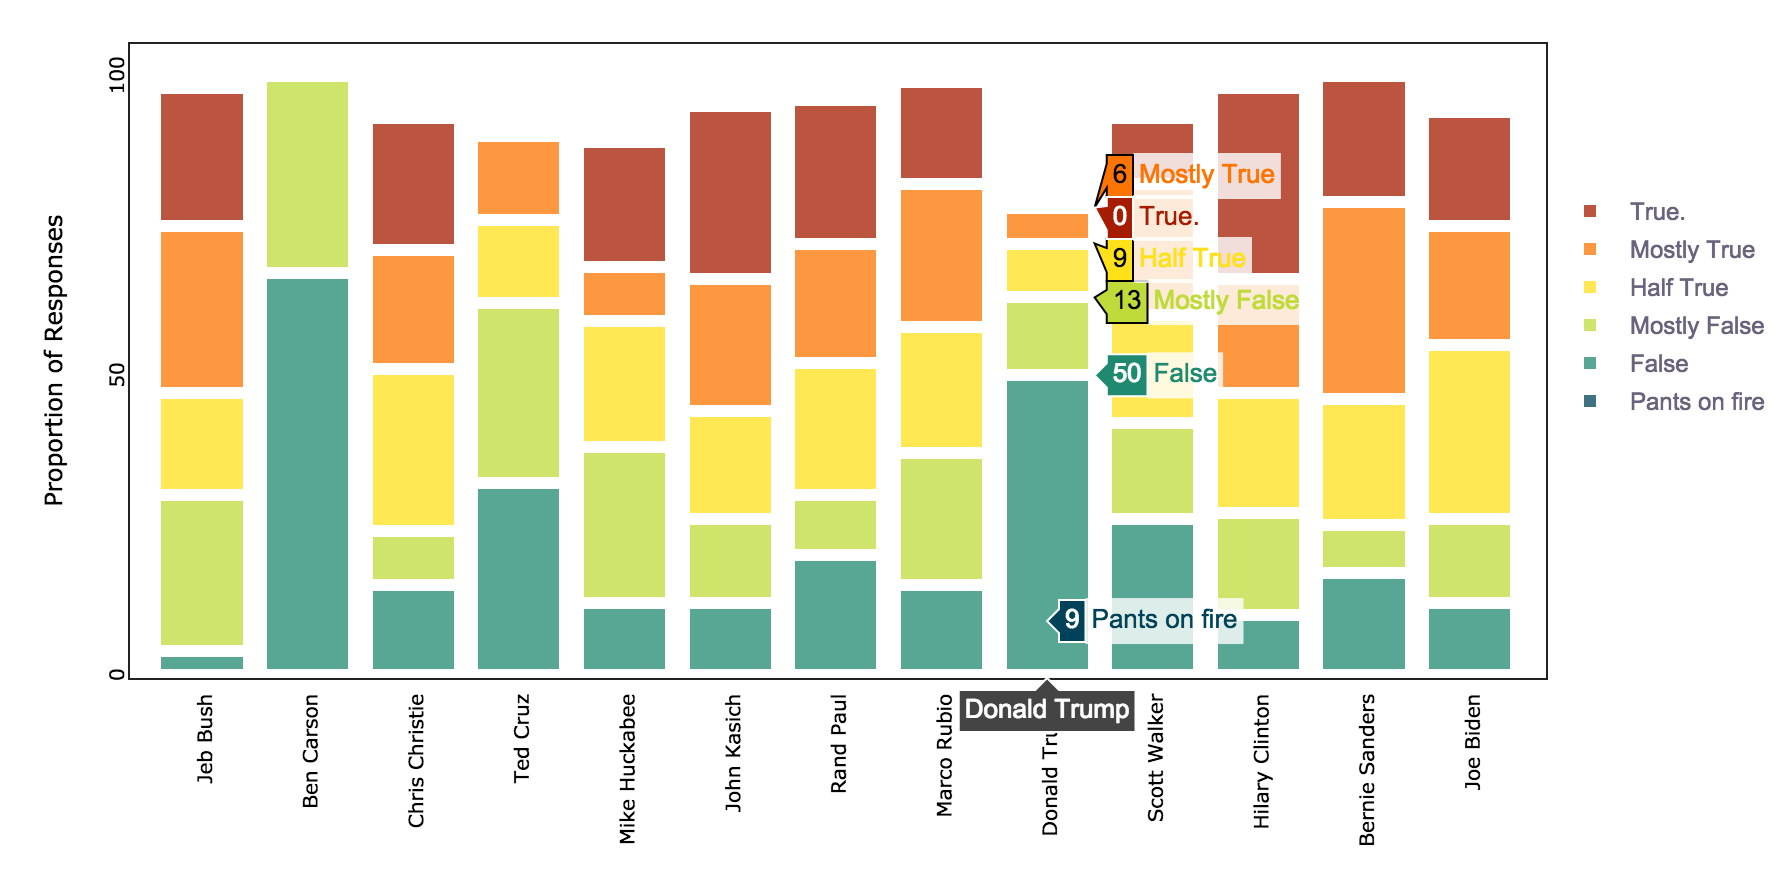
Chart author: @jmareane
Touched up in Plotly Online Editor.
Python code to make this graph: https://plot.ly/~jmareane/225.py
R code to make this graph: https://plot.ly/~jmareane/225.r
3. summer 2016: us democratic candidates in the polls
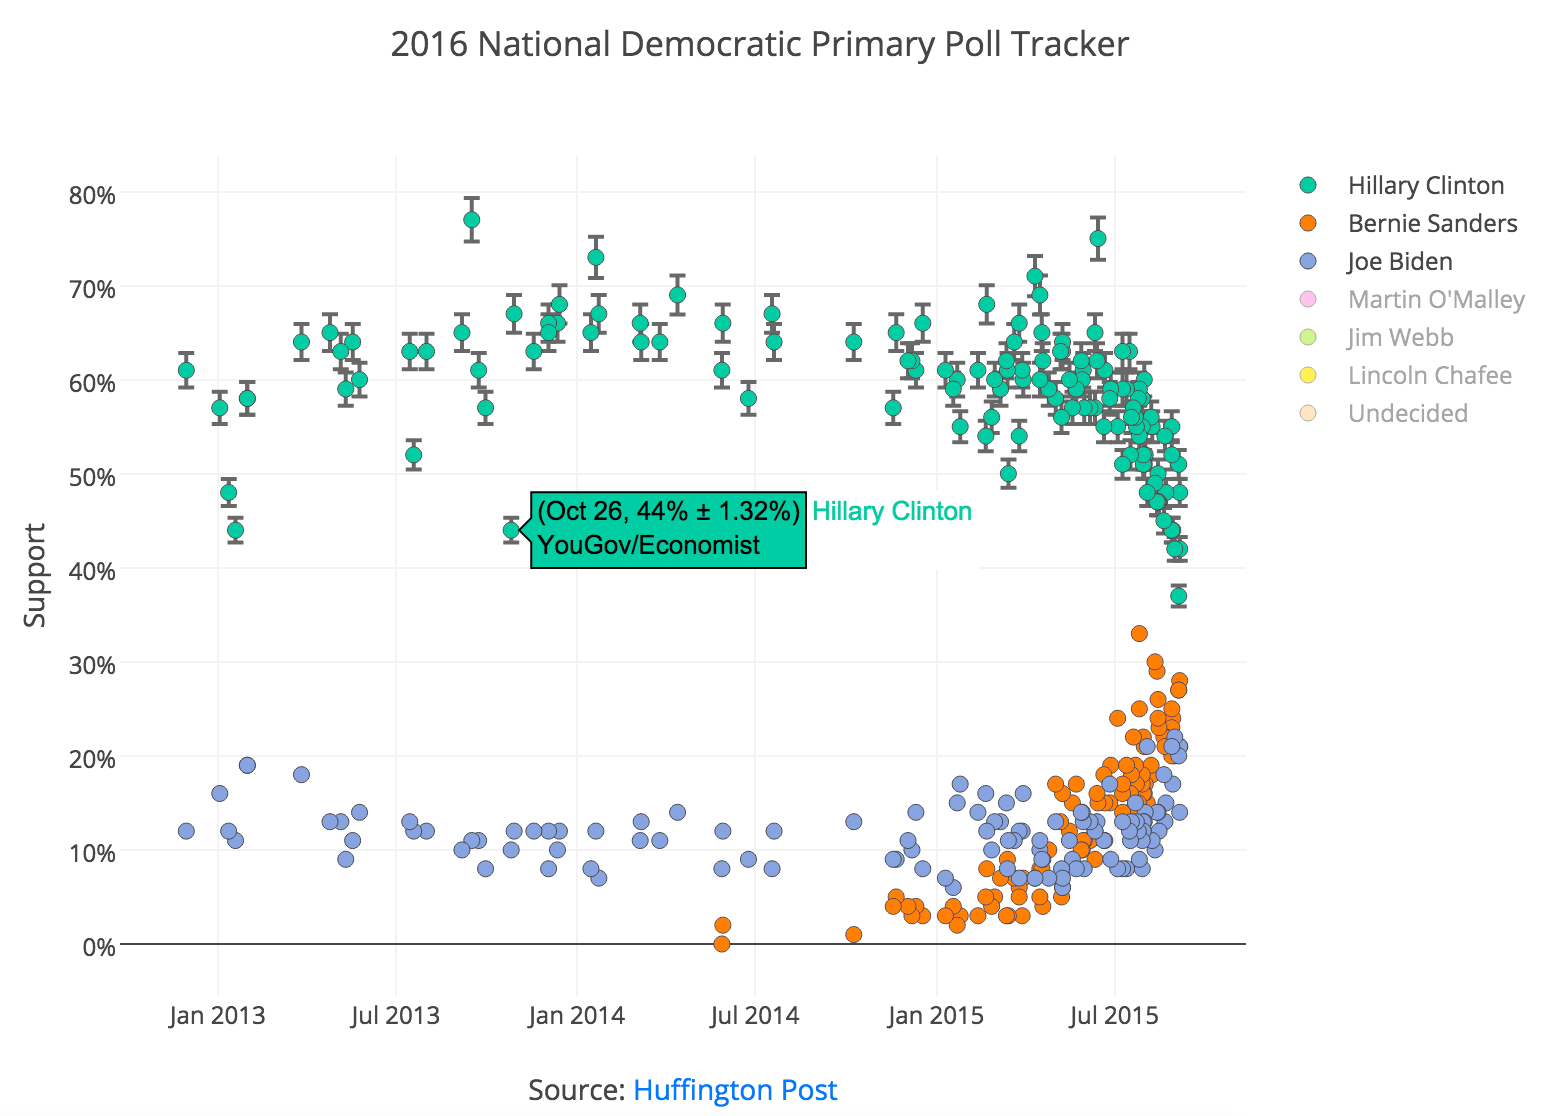
Chart author: @ruicarsa
Touched up in Plotly Online Editor.
Python code to make this graph: https://plot.ly/~ruicarsa/6.py
R code to make this graph: https://plot.ly/~ruicarsa/6.r
4. 2015 greece election polls by party
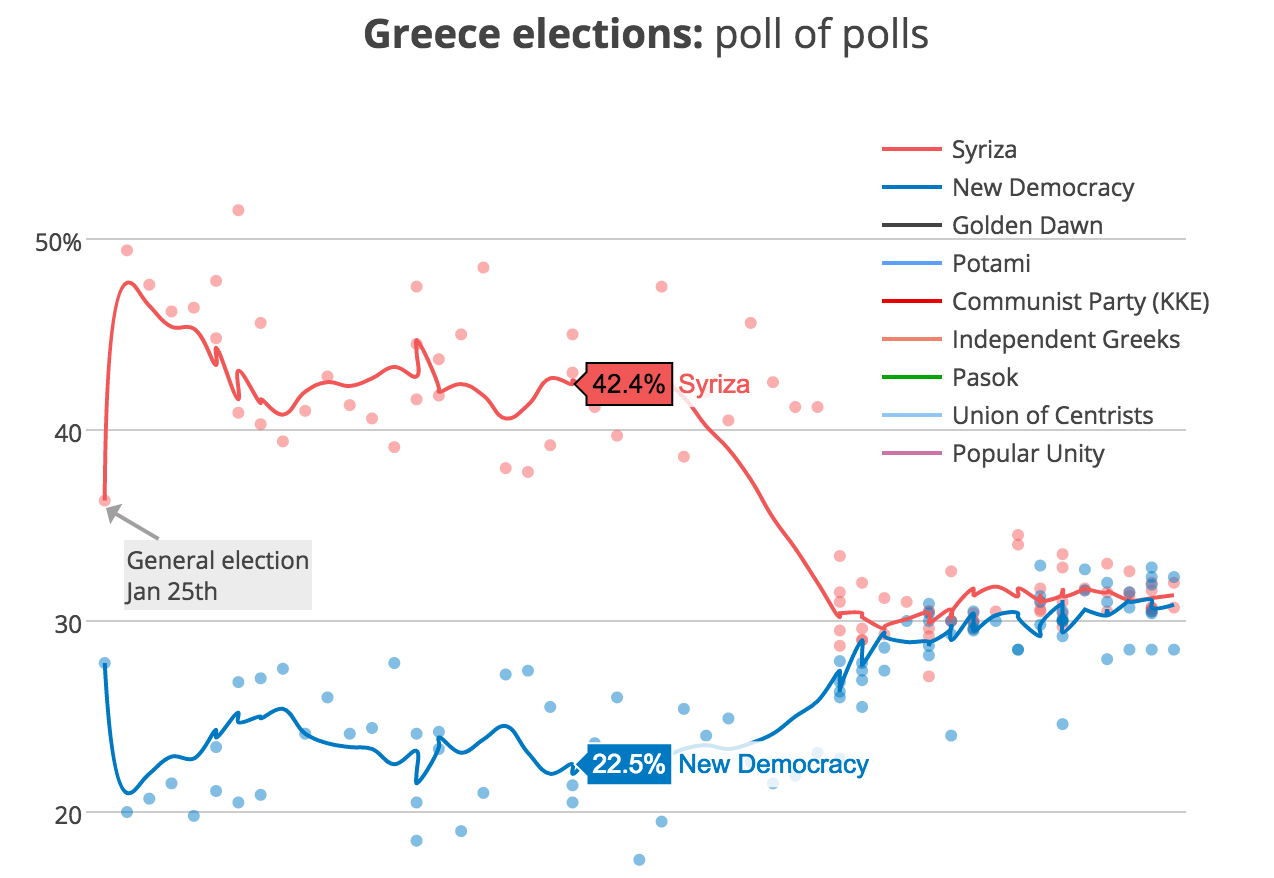
Chart author: @BKilmartinIT
Touched up in Plotly Online Editor.
Python code to make this graph: https://plot.ly/~BKilmartinIT/1140.py
R code to make this graph: https://plot.ly/~BKilmartinIT/1140.r
5. % female candidates in quebec elections
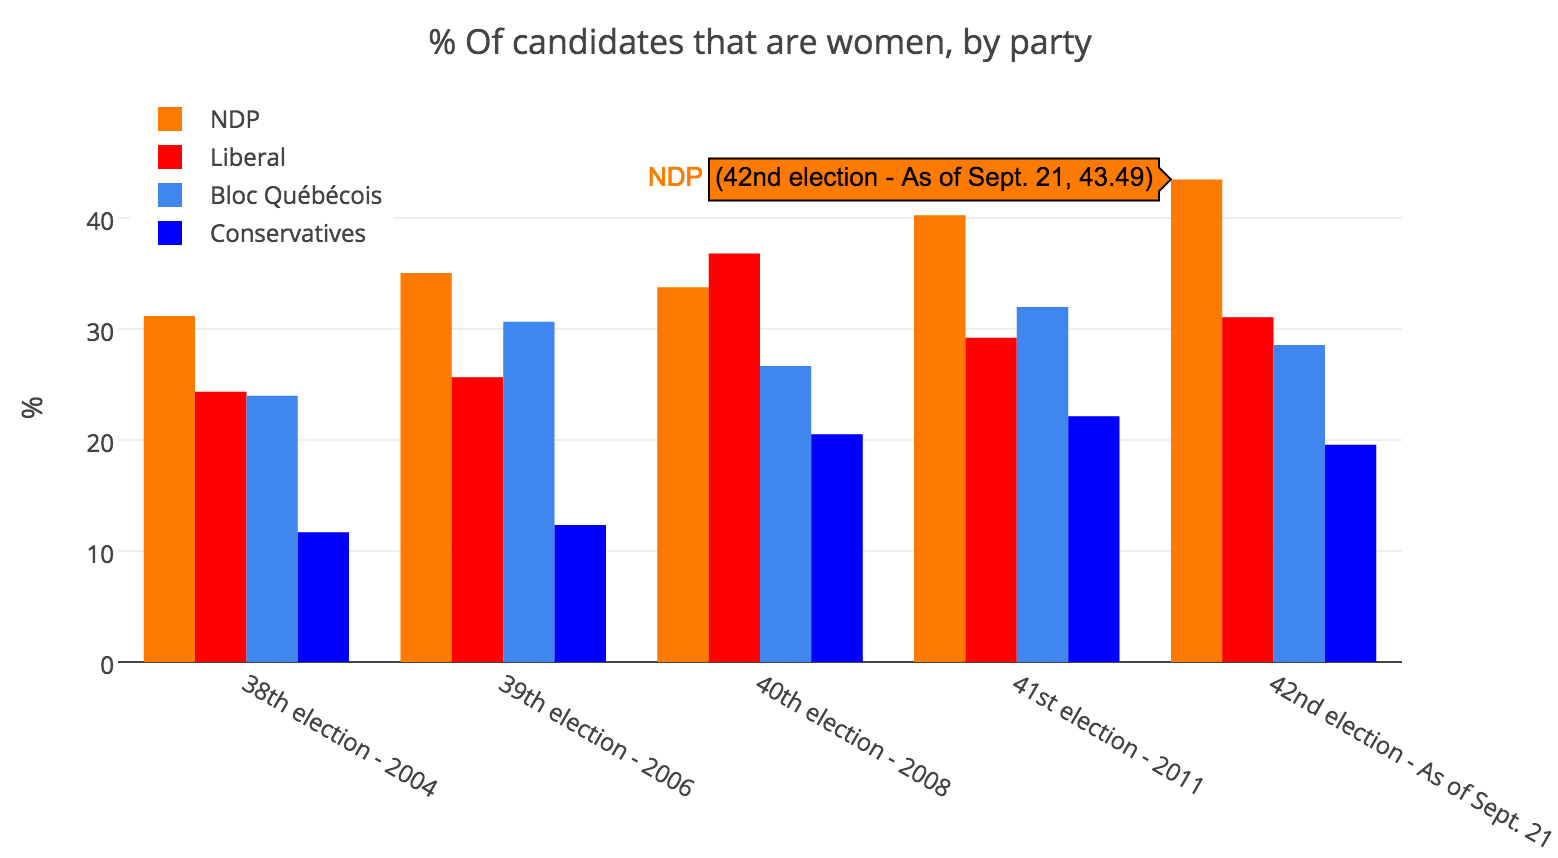
Chart author: @mwarzecha
Touched up in Plotly Online Editor.
Python code to make this graph: https://plot.ly/~mwarzecha/277.py
R code to make this graph: https://plot.ly/~mwarzecha/277.r
6. republican share of the 1960 us election
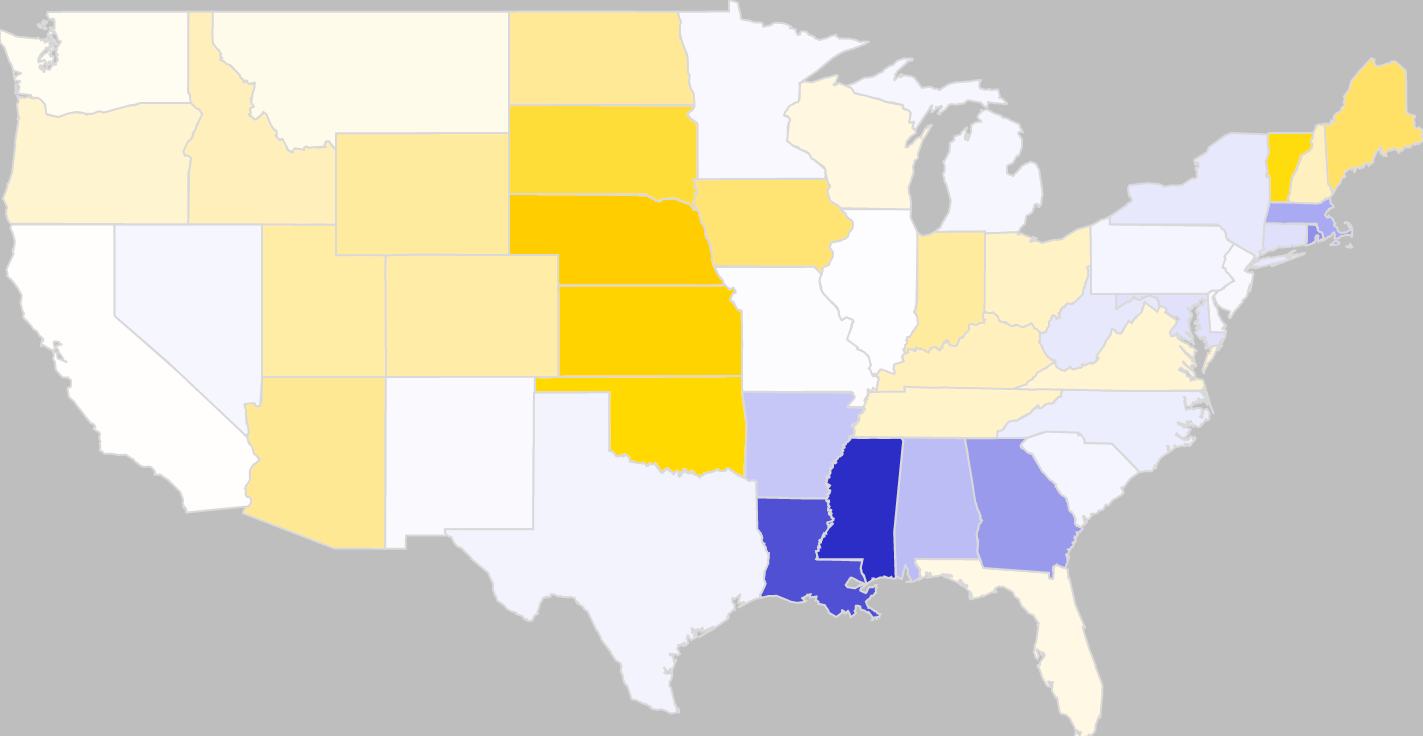
Chart author: @MattSundquist
Made in ggplot2.
Python code to make this graph: https://plot.ly/~MattSundquist/3377.py
R code to make this graph: https://plot.ly/~MattSundquist/3377.r
7. uk election influence on british pound value
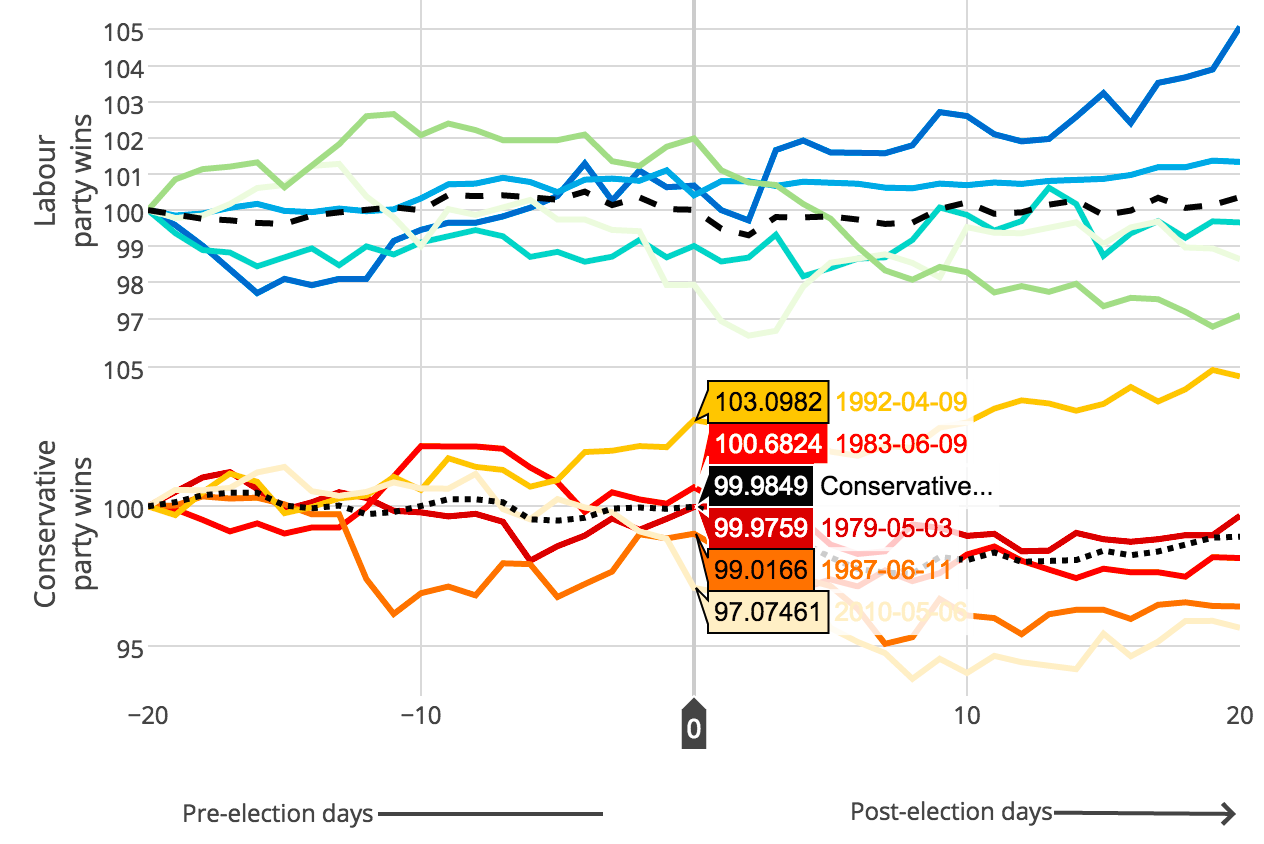
Chart author: @thalesians
Made in IPython notebook.
Python code to make this graph: https://plot.ly/~thalesians/246.py
R code to make this graph: https://plot.ly/~thalesians/246.r
8. Political Prediction Markets: Who will win the nomination for 2015 US presidential election?
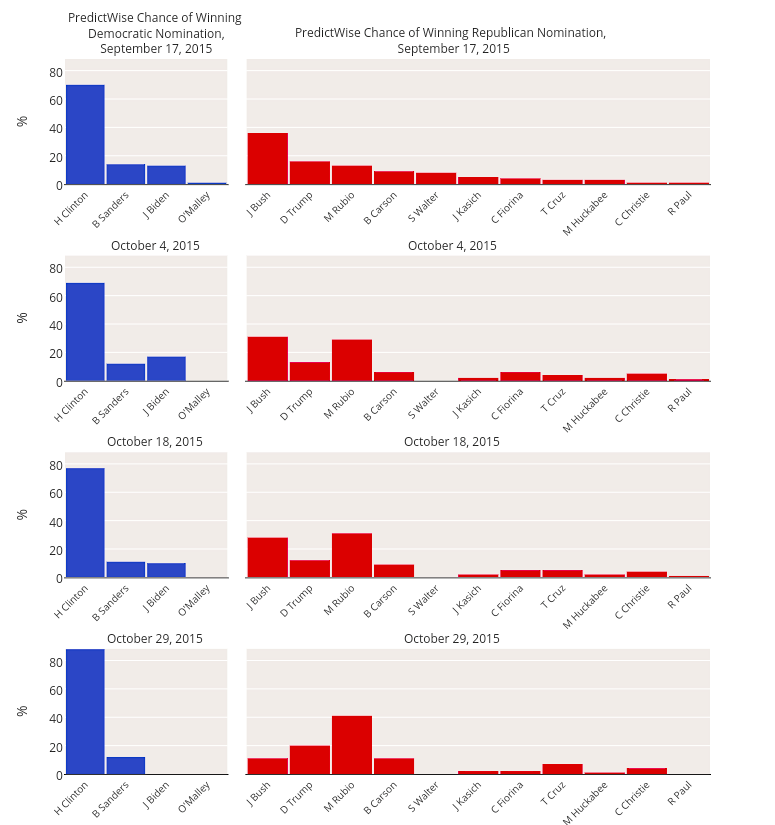
Chart author: @empet
Made in IPython notebook.
Python code to make this graph: https://plot.ly/~empet/6450.py
R code to make this graph: https://plot.ly/~empet/6450.r
9. map colorscales for democrats and republicans
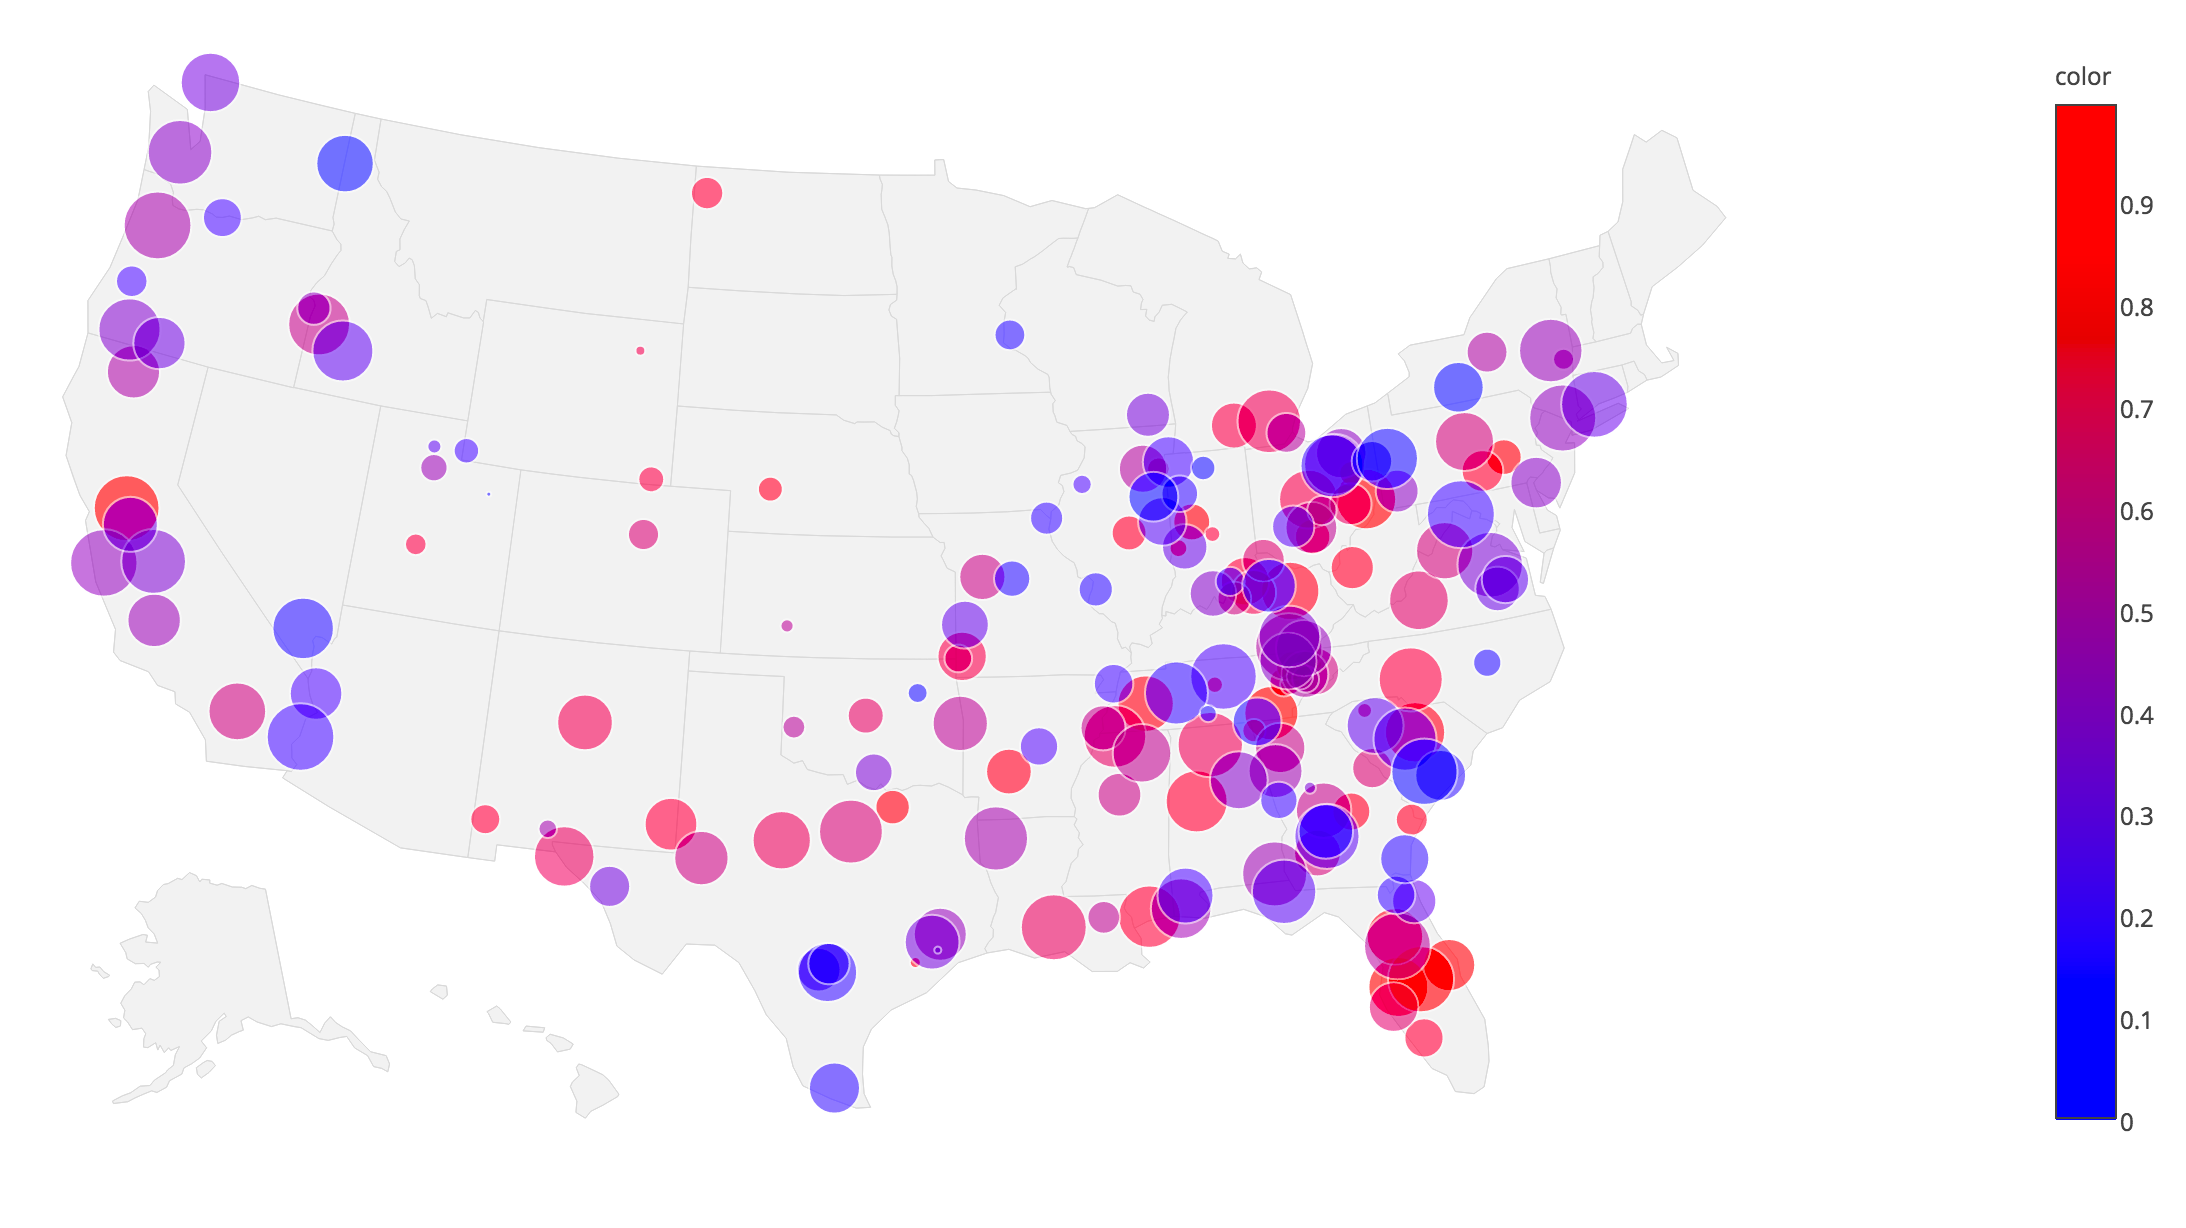
Chart author: @robert.cobb
Made in R.
Python code to make this graph: https://plot.ly/~robert.cobb/4.py
R code to make this graph: https://plot.ly/~robert.cobb/4.r